Construction Outlook for Trenchless Construction Markets
January 21, 2014
 “If it ain’t broke, don’t fix it.”
 This is an old bit of folk wisdom that sometimes seems like a good approach to problem avoidance. However, if you hear someone say this about a bridge you cross every day, the plane you are about to board, the brakes on your car after 40,000 miles or the nuclear power plant about three miles away, you might want to ask, “How do you know it ‘ain’t broke’? Have you inspected it lately?”
These examples cover just a few of the immediate things in our lives that are visible. But what about the “invisible,” that is, the infrastructure beneath our feet, houses and highways? The underground infrastructure is what brings drinking water to our tap, gas to our heating and cooling systems, as well as electricity and oil and gas from source to plant to homes and businesses. Most days, it all works just fine. But there are thousands of towns and cities where that infrastructure is quietly, invisibly deteriorating long after its normal life span has been reached. Failing pipes cause loss of water, accidents in sink holes and even deaths due to explosions and flooding. Even then, it all seems localized, “can’t happen here,” and is soon ignored. The fact is that such infrastructure failures can happen most anywhere in America.
No boom in business is expected in the near future, as FMI’s forecast for markets that include this type of work demonstrates. However, business for underground services can differ greatly by region in both growth rate and type of work done. The bottom line is that we expect continued slow growth. Nevertheless, it is also worth noting that, if the population and politicians were to suddenly get serious about fixing the nation’s infrastructure for water and wastewater, the construction industry would be scrambling to keep up, and prices would jump accordingly. As it stands, municipalities doing work now are likely getting ahead of potential price increases in the future.
FMI Construction Forecast
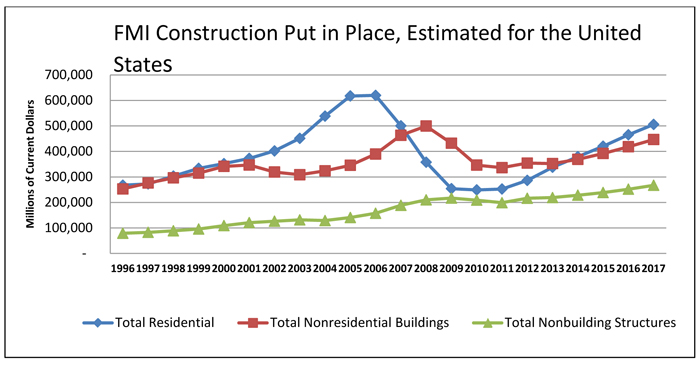
FMI’s overall 2013 forecast for U.S. construction put in place was revised down 3 percent from 2012 to 6 percent for 2013 as the Q3 report for construction put in place reflected. The revised figure for total construction put in place for 2013 is $909.6 billion, but we expect growth to return to 7 percent in 2014 and hit $977.1 billion. While we expect residential to continue its growth trend — but not at the rate of 2013 — growth in all other markets will slow in 2014. Nonetheless, construction is once again outpacing GDP growth and should continue to do so for the forecast period. Growth in lodging construction will moderate in 2013, but still increase by 15 percent, overall a long way from the boom years prerecession; but everything “looks like up” from where it was a few years ago. Transportation construction will continue to grow faster than overall construction, but may be slowed due to reduced government subsidies.
While there is no singular reason for the drop in these markets — each is evaluated on its own criteria — there are a few economic concerns that touch all of them. The first is the continued decline in public construction and expectations of more as the sequestration continues. Second, lenders are still tight with their lending criteria. Consumers are still cautious about increasing their debt load, and that includes their share of public debt with new bond issues for local municipalities.
Residential Construction
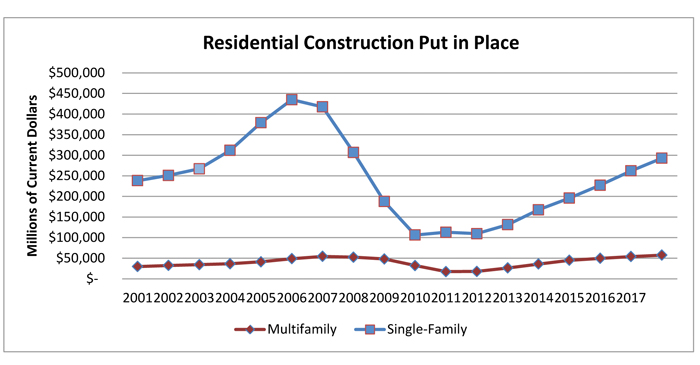
Even though there has been some backpedaling, growth in residential construction continues to show some traction. However, we expect the rapid growth to taper off to 12 percent in 2014. Increasing interest rates will keep any large bubbles from forming with single family still increasing at 17 percent over 2013 and multifamily construction slowing from 36 percent growth in 2013 to 25 percent in 2014. Our total forecast for residential, including improvements, is $379.6 billion, compared with $338.2 billion for 2013. Total residential was $619.8 billion in 2006 before the bubble burst. Now we are in catch-up mode for all of those people who have been putting off buying a home. We don’t expect the growth spurt to continue at such high rates, so our forecasts for 2015 and 2016 are around 11 percent.
The numbers for housing starts are a little bit jagged. The shadow inventory of homes in foreclosure is diminishing, and that is helping to bring housing prices up. At the same time, housing inventory has increased to 21.4 percent for 2013, according to Calculated Risk (Aug. 26 2013.). This push/pull supply and demand will keep the rise of residential housing in check until wages catch up with price gains, which is happening for the high-wage earners, but not for the middle-class homebuyers.
NONBUILDING STRUCTURES
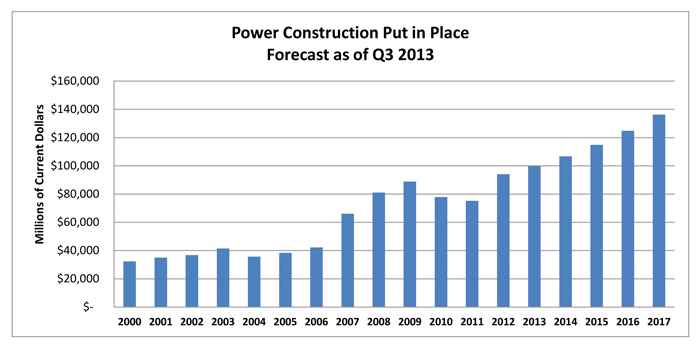
Power ConstructionConstruction for the power market grew 25 percent in 2012, but has slowed to just 6 percent in 2013. For 2015 through 2017, we expect 7 to 9 percent growth. The power market offers a relative bright spot compared to other infrastructure markets, such as transportation and water. The shale story continues to unfold and change the nation’s energy landscape, creating design and construction opportunities across the energy supply chain. According to the Interstate Natural Gas Association of America, the United States and Canada need 28,900 to 61,600 miles of additional pipeline by 2030. The U.S. Energy Information Administration forecasts that natural gas-fired plants will account for 63 percent of capacity additions from 2012 to 2040. In addition to shale, investment in power delivery systems continues to grow with no signs of stopping in the near to midterm. The primary wild card in the power market is continuing uncertainty around EPA regulations on air and water quality.
Despite regulatory uncertainty, the power market should continue to experience robust growth in 2014. Shale-related activity and power delivery opportunities should continue to drive the market. According to the “Annual Energy Outlook 2013” from the U.S. Energy Information Administration, “The advent and continuing improvement of advanced crude oil production technologies continue to lift projected domestic supply. Domestic production of crude oil increases sharply in AEO2013, with annual growth averaging 234,000 barrels per day (bpd) through 2019, when production reaches 7.5 million bpd.”
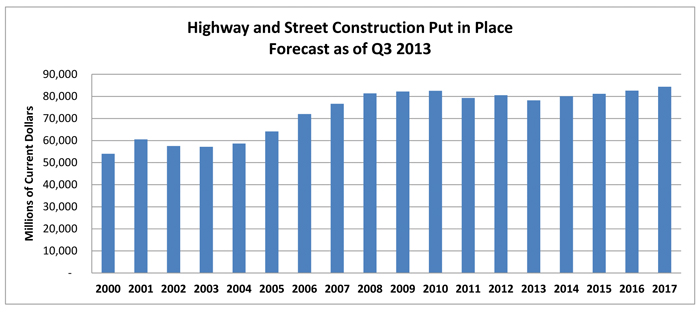
Highway and Street
While MAP-21 was a step in the right direction, the federal funding picture remains bleak overall. States that are in a position to do so are taking action to address their own transportation funding shortfalls. As a group, however, many are just now recovering from the significant budget shortfalls faced in the wake of the recession and are not in a position to move forward without help from federal programs. While the use of the P3 approach to project financing and delivery may be a growing answer, it isn’t an immediate answer to growing infrastructure needs.
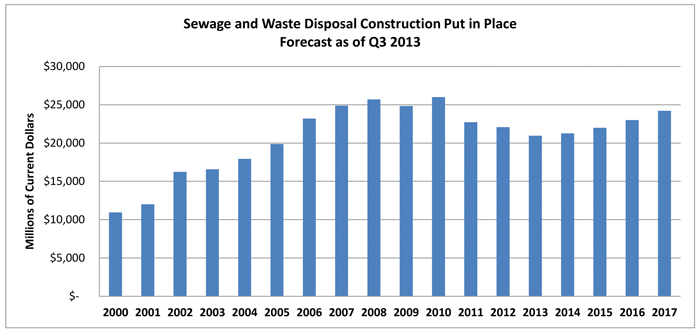
Sewage and Waste Disposal
Construction for sewage and waste disposal is forecast to be down 5 percent in 2013; however, we expect a 2 percent improvement in 2014 to around $21.3 billion. The ability to fund necessary water infrastructure improvements is central to the decline, as many municipal water systems still depend on the tax base for funding. Growth, driven by aging infrastructure and regulation, is on the horizon, but the length of the horizon is still unknown. Slow water infrastructure markets in the aftermath of the recession continue to build the backlog of necessary work as existing infrastructure ages. There are 16,000 wastewater systems nationwide that need replacement discharging more than 850 billion gals of untreated sewage into surface waters each year. Combined sewer systems (stormwater and sewage) serve roughly 950 communities with about 40 million people. Most communities with CSOs are located in the Northeast and Great Lakes regions and need replacing or upgrading to be more sustainable and environmentally compliant. The Clean Water State Revolving Fund (CWSRF) programs have provided more than $5 billion annually in recent years to fund water-quality protection projects.
Water Supply
Construction for water supply projects will improve 5 percent in 2013 after dropping 7 percent in 2012. In 2012, $36.5 billion of tax-exempt municipal bonds were used at the state and local level to address water infrastructure needs, which represents a 33 percent increase over 2011. Additionally, a number of states are making changes to tax systems in an attempt to find the right balance between growth and taxation. In March 2013, the Senate Environmental and Public Works Committee unanimously approved a Water Resources Development Act, including a measure to create the Water Infrastructure Finance and Innovation Act (WIFIA). WIFIA would provide $50 million per year from 2014 to 2018 to help fund large-scale water infrastructure projects.
Strength in the mining sector creates a tremendous amount of water infrastructure work throughout North America and abroad. Strength in commodity markets continues to drive increased levels of mining activity through the development of new mines and redevelopment of existing mining assets. Heightened mining activity leads to increased demand for related infrastructure, including water.

Federal assistance for the safe drinking water State Revolving Fund (SRF) in the 11-year period between 1997 and 2008 totaled $9.5 billion, just slightly more than the investment gap for each of those years.
Green construction practices, such as controlling runoff to avoid overburdened rivers and streams and replenish needed groundwater, will become the norm for improvements and new construction.
Phil Warner is a research consultant specializing in construction industry market research. He manages FMI’s Nonresidential Construction Index survey.