Parametric Study of Pullback Forces on Pipelines Installed by Horizontal Directional Drilling
August 24, 2015
This paper reviews the design parameters for the pullback force calculation during Horizontal Directional Drilling (HDD) method. A comparison was made between actual measured pullback forces and theoretically calculated values for more than 50 HDD projects. The study showed that the measured pullback forces were higher than the theoretically calculated forces for small HDD installations, while the results were reversed in the case of medium and particularly large HDD projects. Among many factors affecting pullback force, the design values for soil coefficient of friction, fluidic drag coefficient, drilling mud density and roller coefficient of friction are often assumed the same in the calculation for all different HDD projects.A parametric study was carried out to show the significance of these design input values in the pullback force estimation. Comparison of the results with the actual recorded pullback forces suggested modifying the design values based on the specific design case in order to enhance the accuracy of theoretical calculations. Design of Experiment (DOE) methodology was also used to further study the significance of design parameters on pullback force. The study showed that the order of significance of the design parameters varied for different case studies and the impact of one factor on pullback force is relatively independent of the level of the other factors.
Introduction
The HDD methodology has three essential stages: pilot bore, pre-ream and pullback. During the pullback stage, the pipe being installed is subjected to a complex combination of various forces. Accurate estimation of pullback force is necessary during the design stage of HDD projects to select the appropriate product pipe and rig size. The product pipe should be designed to have adequate strength to avoid damages during installation while the HDD rig should be capable of successfully pulling the pipeline.
Pullback force estimation can be relatively complicated due to the numerous factors affecting the pullback. Pipe properties, borehole geometry, existence of a buoyancy control, soil properties, drilling fluid properties, pipe handling on surface and rate of pullback are some of the many factors that are significant in pullback force estimation. Most of the required information for force analysis is site specific, vary from one job to the other and some is unknown or hard to determine. Therefore, implementing simplifications and assumptions into calculations for engineering design purposes are an inevitable fact. The key to a good design of HDD crossings is to select the right parameters for each specific project using rational assumptions, despite the many uncertainties associated with each project.
Pullback force calculation method based on the Pipeline Research Council International (PRCI) (J.D. Hair & Associates, 2008) has been widely accepted in the industry as it incorporates well-known static and dynamic concepts and applies them for use in HDD design. The total pull force required for pipe installation is calculated by summing forces resisting the pipe movement in straight and curved segments of the borehole. PRCI has proposed equations for different sections of drill path as the pipe is pulled through each of them.
Design of HDD projects is important particularly for the larger scale projects where any delay in project execution could create an economic nightmare and an efficient design could result in considerable savings while delivering the project on time. This paper presents the results of a comparison between the predicted and actual measured pullback forces for more than 50 projects. To further investigate the significance of design input variables, a parametric study was completed. Design of Experiment (DOE) was also used to study the dependency of the calculated pullback force on the design variables.
Theoretical vs. Measured Pullback Forces
Fifty-four HDD projects located throughout Alberta and Northern British Columbia were selected to compare estimated theoretical pullback forces vs. actual measured forces. These projects were designed, inspected and monitored during their construction by CCI Inc. between 2012 to 2014. The projects involved installation of single steel pipe ranging in diameter from 114 mm (NPS 4) to 1,067 mm (NPS 42). The subsurface geological materials encountered during the projects comprised clay, silt, sand, gravel overburden soils and clay shale, sandstone, siltstone and coal bedrock. The HDD rigs ranged in size from 80,000 lbs (push/pull) to 110,000 lbs for small HDD installations, 140,000 lbs to 220,000 lbs for medium HDD installations, and 330,000 to 1,100,000 lbs for large HDD installations.
Actual rig load during pullback operations was recorded in the field for each project. In a majority of the cases, the maximum rig force was recorded near the pullback completion. Assuming that the forces required to pull the drill pipes and the reamer assembly are negligible at the end of the installation, the actual rig force can be compared with the theoretical force required to pull the product pipe. In general, it is a conservative approach to compare the maximum theoretical pullback force calculated based on PRCI with the actual maximum rig load. However, due to the lack of reliable data to quantify the amount of force required to pull the reamer assembly, there are currently no design methods available to estimate the actual HDD rig pull force. HDD engineers estimate the total rig load by adding safety factors to their pullback force calculations.
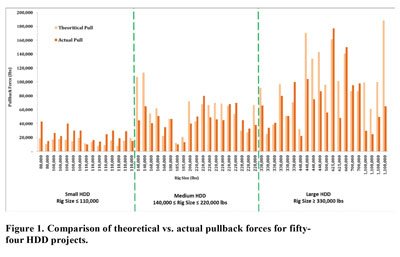
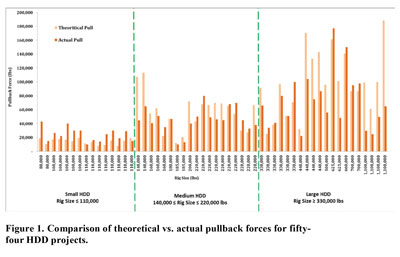 The theoretical and measured pullback forces for all 54projects were summarized in Figure 1, which illustrates pullback forces based on the HDD rig size used on each project. The projects were categorized into three groups: small HDD, medium HDD and large HDD installations. The average variation observed between theoretical and actual forces was different for each group. For small HDD installations, actual forces were 35 percent underestimated by the theoretical calculations while theoretical forces were higher than actual loads by 26 percent and 54 percent for medium and large HDD installations, respectively.
It should be noted that the execution of the HDD construction is a major factor affecting the pullback force. Generally speaking, better quality of workmanship, better equipment, and better execution of the job are implemented for large HDD installations to account for the higher risks and costs associated with each project. Proper conditioning of the borehole, multiple reaming passes and slow pull rate in large HDD operations eliminate excessive mechanical work required for pulling the pipeline. On the other hand, poor borehole cleaning in small HDD projects leads to additional forces required to displace soil cuttings during pullback. The over conservatism in PRCI equations is another factor that contributes to overestimation of pullback forces in longer and larger diameter HDD crossings.
Accuracy of pullback force estimation can be improved by modifying the design input values and safety factors. The type of project, subsurface conditions and quality of project execution can all be taken into account during the design stages of HDD operations. Careful selection of design input values are necessary in order to properly estimate the actual pullback process. The next section presents a parametric sensitivity analysis to investigate the changes of design input values on pullback force and compares the estimated forces with actual measurements.
Parametric Study
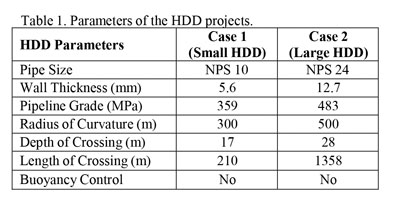 The HDD pullback force calculation depends on various parameters. Some of these parameters depend on site specific conditions such as borehole geometry, subsurface conditions and pipe properties, and their input values vary according to the case requirements. However, certain parameters such as soil coefficient of friction, drilling mud density, fluidic drag coefficient, and roller coefficient of friction are usually assumed the same for all the cases. In this parametric study, significance of these parameters on pullback force calculation is investigated. The sensitivity analysis was conducted for two case studies; representing small and large HDD installations. Table 1 presents the parameters of the case studies.
Typical values and ranges for the selected design parameters are discussed below:
i) Soil Coefficient of Friction, µsoil – This parameter depends on the soil conditions along the bore path, which the pipeline is pulled through. PRCI suggested a value of 0.3 for HDD installations where the pipe is pulled through a hole filled with drilling fluid. For this study, a range of values from 0.2 to 0.4 is defined for this parameter.
ii) Drilling Mud Density, Wmud – Typically, the range for drilling mud density in HDD application varies from approximately 9 ppg (1078kg/m3) to 11 ppg (1318 kg/m3), considering clean bentonite content to higher solid content. A conservative value of 14 ppg (1678kg/m3) is used in this study as the upper limit.
 iii) Fluidic Drag Coefficient, µmud – The fluidic drag coefficient depends on the drilling fluid rheology, flow rate, annular geometry, and rate of pull. The PRCI recommends the value of 0.025 psi for the fluidic drag factor. A range of 0.0025 psi to 0.0475 psi was selected for this study. Further details on the fluidic drag coefficient can be found in Faghih et al. (2015).
iv) Roller Coefficient of Friction, µroller – The PRCI calculation does not typically consider the friction between the pipeline and the roller on the surface. Hence, a range of 0.0 to 0.2 was selected for this parameter.
Pullback force was calculated as each parameter deviated from its mean value. The mean values of the parameters are µsoil=0.3, Wmud=1400 kg/m3, µmud=0.025 psi and µroller=0.1. These values are commonly used by engineers to design HDD projects.
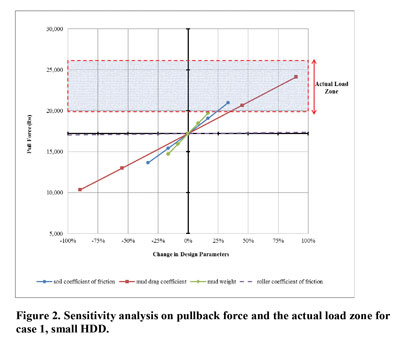
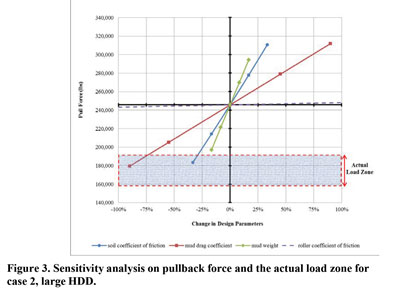
Figures 2 and 3 show the results of the sensitivity analysis for small HDD and large HDD installations, respectively. Ranges of actual rig loads recorded near the pullback completion are also shown on the graphs. The pullback estimation based on the average values of the parameters suggested maximum pullback forces of 17,000 lbs for case 1 and 246,000 lbs for case 2. These graphs show the ranges of design input values that bring the pullback force estimation in the actual load zone. For the case of small HDD as shown in Figure 2, higher values of the defined range for mud density, soil coefficient of friction and fluidic drag coefficient would result in realistic pullback force estimation. For large HDD as shown in Figure 3, lower range of µmud and µsoil would lead to better accuracy in pullback force estimation. In both cases, changes in µmud resulted in higher amount of variation in pullback force. This is due the wide range of possible input values for this parameter. Roller coefficient of friction had the least impact on pullback force for both case studies.
 Design of Experiment
DOE is a systematic approach to the investigation of a system or process, where the planned changes are made to the input parameters to identify their effects upon the response or the output. The parameters of interest are first identified, and then the experiment or analysis is carried out at certain ranges of the value, known as ‘high’ and ‘low’ representing the maximum and minimum magnitudes of the parameters. DOE results can be used to understand the effect of each parameter and their interaction (if any) with other parameters upon the output.
‘One change at a time’ testing always carries the risk that the experimenter may find one input variable to have a significant effect on the response (output) while failing to discover that changing another variable may alter the effect of the first (i.e. interaction between parameters). This is because the temptation is to stop the test when this first significant effect has been found. However, DOE plans for all possible dependencies in the first place, and then prescribes exactly what data are needed to assess them, whether input variables change the response on their own, when combined, or not at all.
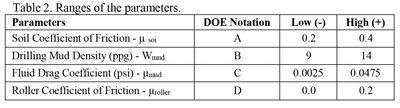 For the case study described in this paper, the identified parameters were set at two different levels (low and high) and then the pullback force was calculated. 2k combinations were considered that represents the ‘full factorial’ design where 2 represents the level of ranges, which is ‘low’ and ‘high’, and k represents the number of parameters chosen which is 4 in this study. So, a total of 16 runs of pullback force calculations were measured at different combinations of defined parameters at different levels. The parameters and their ranges are presented in Table 2.
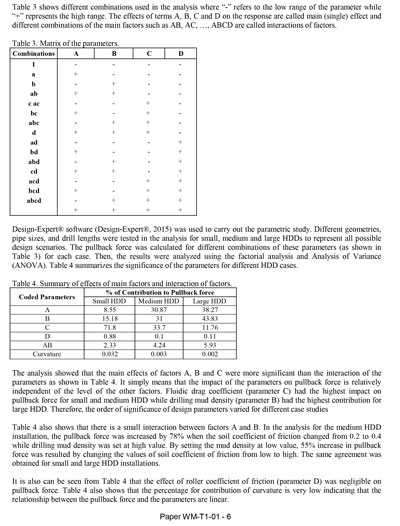 Table 3 shows different combinations used in the analysis where “-” refers to the low range of the parameter while “+” represents the high range. The effects of terms A, B, C and D on the response are called main (single) effect and different combinations of the main factors such as AB, AC, …, ABCD are called interactions of factors.
Design-Expert software (Design-Expert, 2015) was used to carry out the parametric study. Different geometries, pipe sizes, and drill lengths were tested in the analysis for small, medium and large HDDs to represent all possible design scenarios. The pullback force was calculated for different combinations of these parameters (as shown in Table 3) for each case. Then, the results were analyzed using the factorial analysis and Analysis of Variance (ANOVA). Table 4 summarizes the significance of the parameters for different HDD cases.
The analysis showed that the main effects of factors A, B and C were more significant than the interaction of the parameters as shown in Table 4. It simply means that the impact of the parameters on pullback force is relatively independent of the level of the other factors. Fluidic drag coefficient (parameter C) had the highest impact on pullback force for small and medium HDD while drilling mud density (parameter B) had the highest contribution for large HDD. Therefore, the order of significance of design parameters varied for different case studies
Table 4 also shows that there is a small interaction between factors A and B. In the analysis for the medium HDD installation, the pullback force was increased by 78 percent when the soil coefficient of friction changed from 0.2 to 0.4 while drilling mud density was set at high value. By setting the mud density at low value, 55 percent increase in pullback force was resulted by changing the values of soil coefficient of friction from low to high. The same agreement was obtained for small and large HDD installations.
It is also can be seen from Table 4 that the effect of roller coefficient of friction (parameter D) was negligible on pullback force. Table 4 also shows that the percentage for contribution of curvature is very low indicating that the relationship between the pullback force and the parameters are linear.
Conclusions
Accurate pullback force estimation is complicated due to the existence of many factors, which some are site specific and some are unknown or hard to determine. Therefore, implementing simplifications and assumptions into calculations are necessary for engineering design purposes. As a result, design practice recommended by PRCI is widely used in the industry. However, there is a wide range of acceptable design inputs that can be used in the pullback force calculations. In practice, the design values of parameters such as of µsoil, µmud, Wmud, and µroller are often kept the same regardless of the project types. Comparisons between measured and predicted pullback forces proved that larger pipe installation in longer crossings may require less pullback force in practice compared to the one calculated theoretically. Reverse statement is valid for the case of small pipes and shorter crossings. Other factors such as proper borehole cleaning, quality of work execution, and pullback rate are among the many parameters that can change the amount of pullback force during pipeline installation.
A parametric study showed how pullback force changes as values of design inputs vary. For the case of small HDD installations, higher range of values for µsoil, µmud, and Wmud led to close estimation of actual loads. The study for large HDD installations suggested using the low values of µmud and µsoil for design purposes. Further analysis by DOE proved that main (single) effect of factors is major in pullback force while impact of one factor on pullback force is relatively independent of the level of the other factors.
Ashkan Faghih, and Anup Ghimire are with CCI Inc. Edmonton, Alberta, Canada and Dave Dupuis is with CCI Inc., Calgary, Alberta, Canada.
References
Design-Expert Version 9.0.4.1 (2015). Stat-Ease, Inc., Minneapolis, USA.
Faghih, A., Yi, Y., Bayat, A., Osbak, M. (2015). Fluidic Drag Estimation in Horizontal Directional Drilling Based on Flow Equations. Journal of Pipeline Systems Engineering and Practice, ASCE, ISSN 1949-1190/04015006(8).
J.D. Hair & Associates (2008) – Installation of Pipeline by Horizontal Directional Drilling – an Engineering Design Guide. Technical Toolboxes Inc., USA.This paper is copyrighted by the North American Society for Trenchless Technology. Original Presentation given at NASTT’s 2015 No-Dig Show. All rights reserved. www.nastt.org