How Much Should I Spend on Pipe Condition Assessments?
In asking the question, “How much should I spend on pipe condition assessments?,” one must first ask about the design, construction, installation and inspection of the pipeline.
Pipe Installation Considerations
If you did not install pipes correctly, you are already, on average, losing 20 to 50 percent of the pipe’s service life. If you did not inspect the pipe during installation, then you may be only foregoing 10 to 30 percent of the potential service life for that pipe segment. When it comes to long-term underground infrastructure which can last 50 to 300 years, doing things correctly has huge dividends or on the other hand-high costs and risks from decision-making errors. Essentially, with all of the variables influencing pipe service life — condition assessments are needed to identify high risk pipes and also avoid replacing the 40 to 70 percent of good pipes condemned by age-based planning assumptions.
Pipe Material Considerations
Pipe material selection needs to be appropriate for its location, dealing with many variables such as environmental issues and operating conditions. Specifications should be open to allow for the engineering review and analysis. 91 percent of all the installed water mains in the United States utilized a combination of cast iron at 28 percent, ductile iron at 28 percent, PVC pipe at 22 percent, and asbestos cement at 13 percent. Which is interesting considering only two materials ductile iron and PVC remain as options for new installations and replacement. The remaining 9 percent of pipes used are represented by HDPE, steel, concrete steel cylinder and other materials. Each pipe material has different pipe characteristics meaning that the installed environment and operational/environmental factors act differently on each pipe material and can be different for each pipe segment.
Lesson learned from recent studies point out that 75 percent of all utilities have some corrosive soils. Utilities with a higher percentage of iron pipe may experience a higher percentage of corrosion related breaks. Analysis of soil corrosivity shows that traditionally, the thickness of the iron pipe wall provided the additional corrosion protection. Cast iron pipes manufactured after World War II have significantly higher failure rates as a result. Cast iron pipe in highly corrosive soil is expected to have more than 20 times the break rate of cast iron pipe in low corrosive soils. Corrosion is an important failure mode for cast iron and is the predominant failure mode for ductile iron pipe. Cast iron and ductile iron pipe corrode at about the same rate. Ductile iron pipe in highly corrosive soils has over 10 times the break rate, than a ductile iron pipe in low corrosive soil. The many types of corrosion can also be combined with other environmental conditions, all contributing to water main failures because of the wall thickness of metallic pipes has decreased overtime.

Pipe Diameter Considerations
In the total inventory of water pipes, 85 percent of water mains are less than 12 inches in diameter. 67 percent of all water mains are 8 in. or less in diameter. Eighteen percent of water mains are 10 to 12 in. and 9 percent are 14 to 24 in. in diameter.
A national metric of the replacement rate of water mains is 0.8 percent, which equates to a pipe replacement cycle of 125 years with the average pipe break occurring at 50 years. Typical water pipe planning for replacements ranges between 1.0 and 1.6 percent equivalent to a 100 year and 60-year replacement cycle.
A water distribution system as defined by most water utilities considers pipe sizes less than 16 or 24 in. in diameter and anything larger as a transmission pipeline. Pipe diameter matters, as an example overall ductile iron pipe has a break rate of 5.5 breaks per 100 miles of pipe for all sizes, but studies also show a 15.1 break rate for ductile pipe pipes less than 12 in. in diameter.
As a general rule of thumb, larger diameter pipes are more expensive, have less breaks therefore a lower likelihood of failure, but if a break does occur the consequence of failure is more severe. As an example, a 16-in. diameter pipe break could cost $100,000, a 36-in. diameter pipe $800,000 and an 84-in. diameter pipe over $1.5 million just in direct costs, not including water loss and other indirect and societal costs which can average between 50 and 66 percent of a utilities’ direct costs with the repair.
For these larger diameter transmission lines for raw water or treated water the cost is too high and the loss of water delivery to a community too disruptive to allow for failures. As a result, condition assessments for these perpetual lifelines should occur every 10 years and even more frequently if there are known issues.
There is also a business case for continuous monitoring for understanding any change in the condition of these pipes or building redundancy into the system to prevent or mitigate catastrophic failures costing millions of dollars.
RELATED: GASB 34 Reporting of the Value of Buried Infrastructure

Asset Management Programs
The first basic steps of an infrastructure asset management program are to know what assets you own, where they are located and in what condition they are in. At this point of condition awareness, risk mitigation steps combined with funding scenarios play out to develop the rest of the asset management plan.
One definition or major goal of asset management is to achieve the longest useful life of each asset at the lowest cost while delivering the expected level of service. If we unpack this generalized statement, longest useful life would entail pipe material selection, proper design and installation and inspections optimized for the installed environment with periodic pipe condition assessments and analysis to direct changes to maintenance strategies, timely repairs, the use of trenchless technologies and rehabilitation methodologies and open cut replacement considering that a simple aged-based planned intervention will always be wrong considering all of the ongoing and changing variables that can influence the useful life of a pipe. Even the best decay curves with historical data change over time.
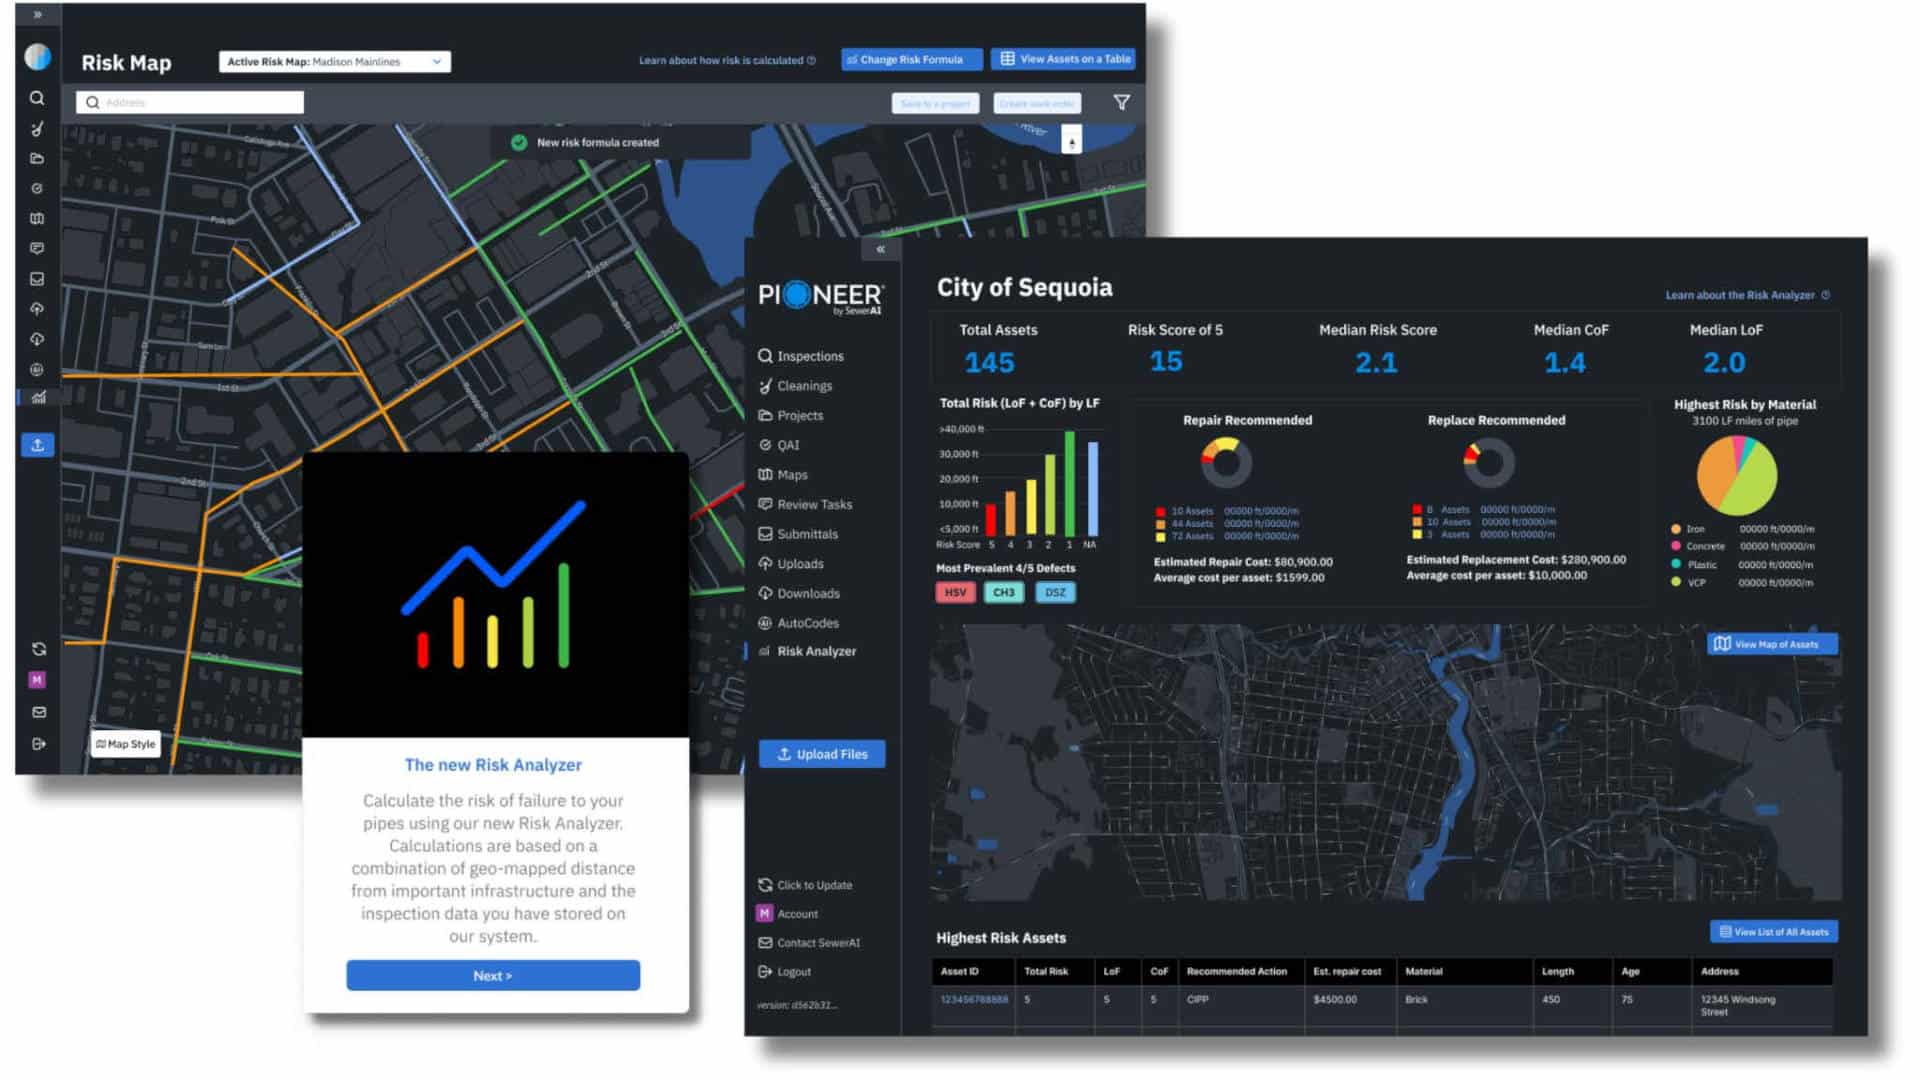
The useful life of the pipe also assumes the entire pipe network and every pipe segment. The “lowest cost” approach with pipe condition assessments for the entire distribution system traditionally held by engineering firms as a desktop statistical analysis has now been replaced with a more cost effective and more accurate AI/machine leaning algorithms and cloud platforms using a non-bias approach of hundreds of variables to apply a percentage-based risk of failure (Likelihood of Failure, or LoF) to every pipe segment for about $0.02 per linear foot.
More importantly is also identify good pipes to avoid asset and financial loss through decision errors. The more break data and bigger the database the more accurate predictions can be made for LoF algorithms also cleaning data and correcting for missing data. Once a LoF can be established for every unique pipe segment a more accurate, yet subjective consequence of failure (CoF) can be calculated by quantifying in dollars the direct repair costs and indirect societal costs of every pipe segment.
This monetized risk or total risk assessment provides a methodology of understanding the carrying risk in dollars which can then be prioritized. As an example, the criticality of a pipe segment failure near a hospital could carry a risk value of $5M while the risk mitigation cost could only be $500,000.
Too many utilities do not understand the actual risk they are carrying and too many financial mangers have asked, “if we make this capital investment what risk amount will it buy down?” Mapping these pipe segment risk values provides a means of grouping together or bundling projects for capital planning efforts while also providing the additional benefit of coordinating with road repair projects and other underground utility right-of-way planning efforts.
Business Process
Asset management requires continual business process improvement and the use of new technologies and methodologies to strive for an overall lower life cycle cost for each asset.
Home-grown or in-house pipe risk analysis models should be tested against AI/machine leaning databases to help verify capital plans to prevent the financial decision error of replacing good pipes while also sharpening the accuracy of identifying high-risk pipe segment clusters.
An AI digital desktop pipe condition assessment solution with LoF and CoF with a monetized total risk value can more efficiently direct maintenance and work order strategies for Computer Maintenance Management Systems (CMMS), while identifying targeted pipe segments for more in depth and traditional condition assessment technologies ranging from leak detection and acoustics monitoring to in pipe wall thickness condition assessments and surveys. Traditional and even innovative pipe leak detection and pipe condition assessments are not cost effective to be used on the entire water distribution system. AI can better focus the other needed condition assessment activities reducing the overall cost of identifying risks and “defects to linear foot spend.” There is also a workforce benefit of AI in water and sewer operations addressing knowledge loss, retention, labor hours, training and recruiting.
AI enablement benefits many asset management and software planning tools which can also provide CoF evaluations and capital repair and replacement plans with financial investment and funding scenarios.
RELATED: Condition Assessment Helps Fountain Valley Devise a Proactive Asset Management Plan
Asset Management Planning
Underground infrastructure asset management planning is complex with changing variables and levels of uncertainty.
Asset management practitioners need the support of all tools which can help determine and extend the life of a pipe segment in a cost-effective manner while meeting expected service levels. Asset managers are faced with the challenge of balancing risk, cost and levels of service while also taking into consideration pipe planning efforts and failure modes.
Assets have four basic failure modes. Capacity (pipes need to be replaced because of a planned increase in water demand due to growth); Physical Mortality (actual pipe break and loss of service); Financial Efficiency or Economic Failure (when it is more cost effective to replace an asset due to high operational or maintenance costs and potentially even the risky burden of very high consequence of failure); and Level of Service (which could consider water quality or rust in the water degrading the chlorine effect; social disruption and the number of water main breaks; non-revenue water loss; poor pressure resulting in public safety/firefighting/insurance issues; public health contaminations; and water boil notices).
Conclusion
Financial accounting may suggest a 1 to 2 percent amount annually of the entire pipe network valuation as a total cost of condition assessment and risk mitigation activities. Engineering firms may suggest a threshold cost of a condition assessment program (statistical desktop review, onsite visits, selection of condition assessment products based on material and diameter, risk analysis and recommendations) at 20 percent of the replacement value of a pipe segment.
The introduction and adoption of AI/machine learning for pipe condition assessments and leak detection reduces the overall costs of traditional condition assessment programs and can accelerate the development of water asset management plans.
While AI cannot address every failure mode or complexity, if you are NOT including AI/ machine leaning in your infrastructure asset management program for underground pipes you are NOT following the best practices and core principles of asset management and in one way or another over time you will be paying more.
Greg Baird is president of the Water Finance Research Foundation.