Get Smart – RH Borden Helps Customers Harness the Power of Sewer System Data
“Smart cities,” has been a buzz phrase in municipal circles for the last decade as cities transition from paper and pencil record keeping to a digitized model. One of the areas where this has taken a greater hold is on the delivery of utilities like water, electric and gas. This talk and shift in technology is now heading to the sanitary sewer pipes under our feet.
One of the companies at the forefront of delivering underground asset data to smart cities is RH Borden, headquartered in South Jordan, Utah. The company was founded by Robert “Bob” Borden and is now helmed by his son Jon Borden, the company’s president.
The company’s roots are as a manufacturer’s rep mostly in the oil and gas space. Bob Borden pivoted the company away from oil and gas during an industry downturn and he moved the company to a service provider role with the Sewer Line Rapid Assessment Tool (SL-RAT) by InfoSense Inc.
“We’ve really pivoted into being a service company to deliver data to smart cities,” says Jon Borden. “When we say smart cities it’s under the broader umbrella of what is going on in the industry where they [system owners] are trying to work with data and make data-driven decisions.”
RELATED: Proactive Sewer Maintenance in El Monte, California
High-Tech Offerings
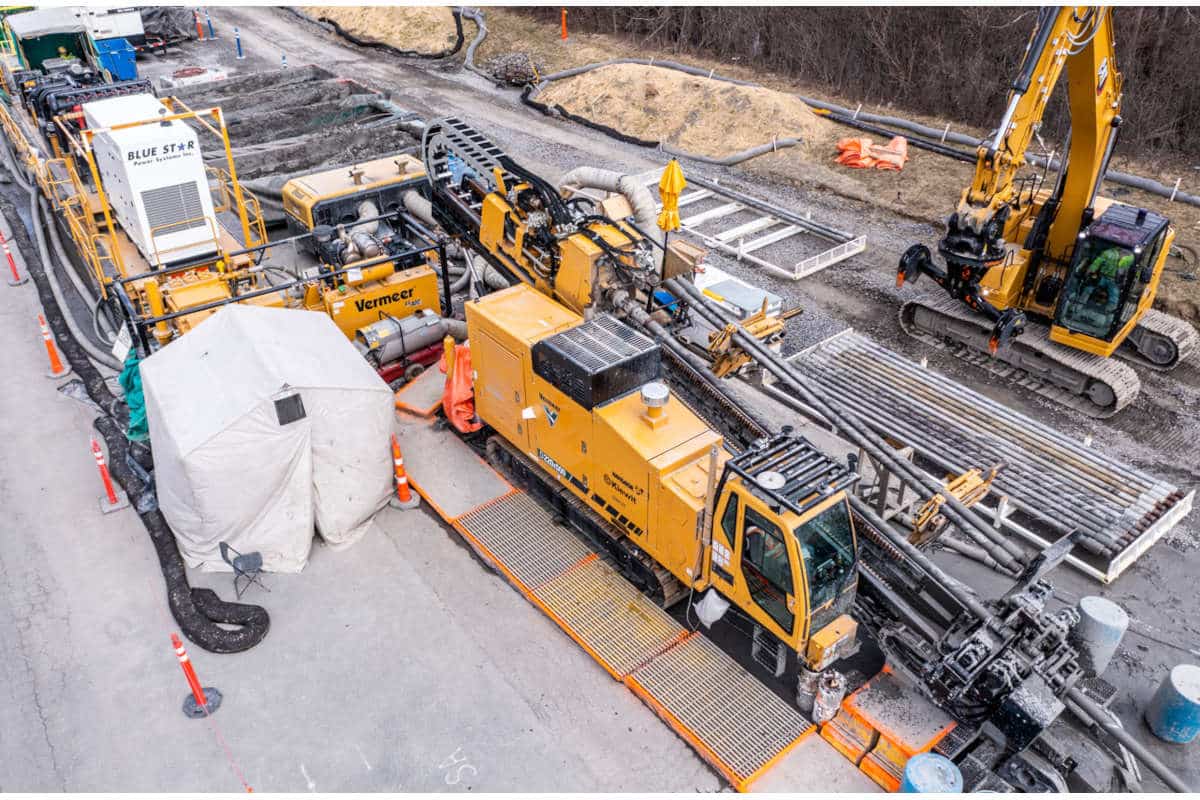
Today, RH Borden has a dedicated team of 15 employees working for 45 customers across Utah, Idaho, Wyoming, Nevada and most recently Arizona; with an eye to expand into Colorado. In addition to the SL-RAT, the company’s latest technological advancement is offering 3D manhole scanning using the CUES Spider.
“My background is in data and IT management. A couple years ago, my dad shared with me some of the devices that he had found,” Borden says. “I was working for General Electric at the time leading an IT portfolio, and I [suggested] building out a data business of our own. That’s when I came on full time and we started to move from a manufacturers rep into a data service provider.”
The 3D manhole scanning component came about in early 2020 as an outcome of a conversations Borden had with customers about what data they were looking for in an overall asset management plan.
“We went out to the market, researched what was available and we became more versed in manhole scanning,” Borden says. “The whole time we’ve been looking for data intensive solutions. The CUES manhole scan creates a data-rich point cloud.”
When talking to Borden it is clear to see that this is an area that excites him and it’s one that he wants to promote to all who will listen. The SL-RAT assessments couple with the CUES Spider manhole scanning to help create a digital roadmap of a city’s overall sewer system health.
One of the things that Jon Borden saw as he looked at this space from the lens of a tech person, was that, while anyone can purchase a system, the actual scanning is only 20 to 30 percent of a project. The lion’s share of the work is done in the office, managing the data. The company’s service also gets to one of the roadblocks of taking a data-driven approach to sewer system monitoring. That is that hosting the data can become cumbersome and not user-friendly.
“Where does the data reside? What server is it on? How do we share it? What is the security like? Those are the questions an owner asks,” Borden says. “That is really the space that we want to help with. Yes, we do the field work, but we also want to do the data work. We can deliver a data service solution where they [the owners] can see all of the same benefits regardless of their size.”

Combined, RH Borden’s two manhole scanning crews can assess 80-120 manholes a day. From scan to having data uploaded to the company’s customer portal is about a week.
Inspection Evolution
3D manhole scanning represents the third tier of manhole inspection and is an integral component of what Borden refers to as the fourth industrial revolution, where our world gets merged with the virtual world.
Tier one is a visual inspection where a person physically inspects the manhole and records that information on paper, or more commonly into a mobile app. This is the least expensive but poses the most problems when it comes to errors. The second tier is a visual inspection with a camera. That information can be taken to an office, analyzed and shared. The analysis, however, can be hampered by the quality of the video or inspector error.
“The third option is creating the high-density point cloud, and I would say it is at the beginning of where it will go,” Borden says. “Once we create the point cloud, now we can put that information into a computer and use artificial intelligence to determine if the manhole is okay or not.”
RELATED: Zoom Camera Technology Improves Pipeline Asset Management Programs
“We have several thousand manholes from local municipalities requested to be scanned already and we are building these [digital] libraries of our infrastructure,” he adds. “It’s happening right now, it’s just a matter of adding a few more features to the software and we will be there.”
The “there” that Borden refers to is a future of artificial intelligence (A.I.) and machine learning that will streamline the way that cities will gather information about their assets.
Does Borden see a future where a city will own its own manhole scanning system or other similar future technology to scan a pipeline?
Most cities, he notes, don’t have the time or the manpower to have people scanning every day and after the initial scan, the system would likely sit on a shelf until the next scan is needed.
As a service provider, RH Borden has two crews out there — with plans to add more — scanning all-day every day. This allows them to offer their services at a reasonable cost and one that makes sense for cities.

With the data, RH Borden’s team can assess the amount of manhole wall loss to see if lining is needed. The scale on the right side shows the amount of wall loss.
Delivering the Data
“All the cities really want is the data from the scans. It is an inefficient path, in my opinion, to invest money into the mechanics of getting that data [the equipment and necessary software] as opposed to letting someone get that for them,” he says. “A service provider can scan all-day every day…and it makes it more efficient from a cost standpoint. Plus, the city doesn’t have to worry about the learning curve of running the equipment and managing the data.”
A single manhole scanning crew can assess somewhere between 40-60 manholes each day. The bulk of the work is processing the data after the scans and uploading it to the ArcGis map portal to share with its customers. This takes about a week.
Once in the dashboard, the system owner has access to a map that indicates all of the data RH Borden has for that owner, whether it be a Spider manhole scan or an SL-RAT acoustic scan of the main pipe. That info can be shared with anyone who can access the dashboard. The city can also take that data and incorporate it into its own asset management software.
Is the demand there for this work? In RH Borden’s region, yes. Within five weeks of setting up operations in Arizona, the company has picked up five months’ worth of work. Borden spends a lot of time educating potential customers on the benefits of a manhole scanning, as well as its acoustic sewer assessment technology with SL-RAT.
“What we find is that we’ll go in and do a pilot project of 40 manhole scans to get them their first taste of scanning. They are interested, but some cities and municipalities are further ahead,” Borden says. “One of our local cities we scanned over 1,000 manholes last year and they asked us to do the rest of the system this year. “

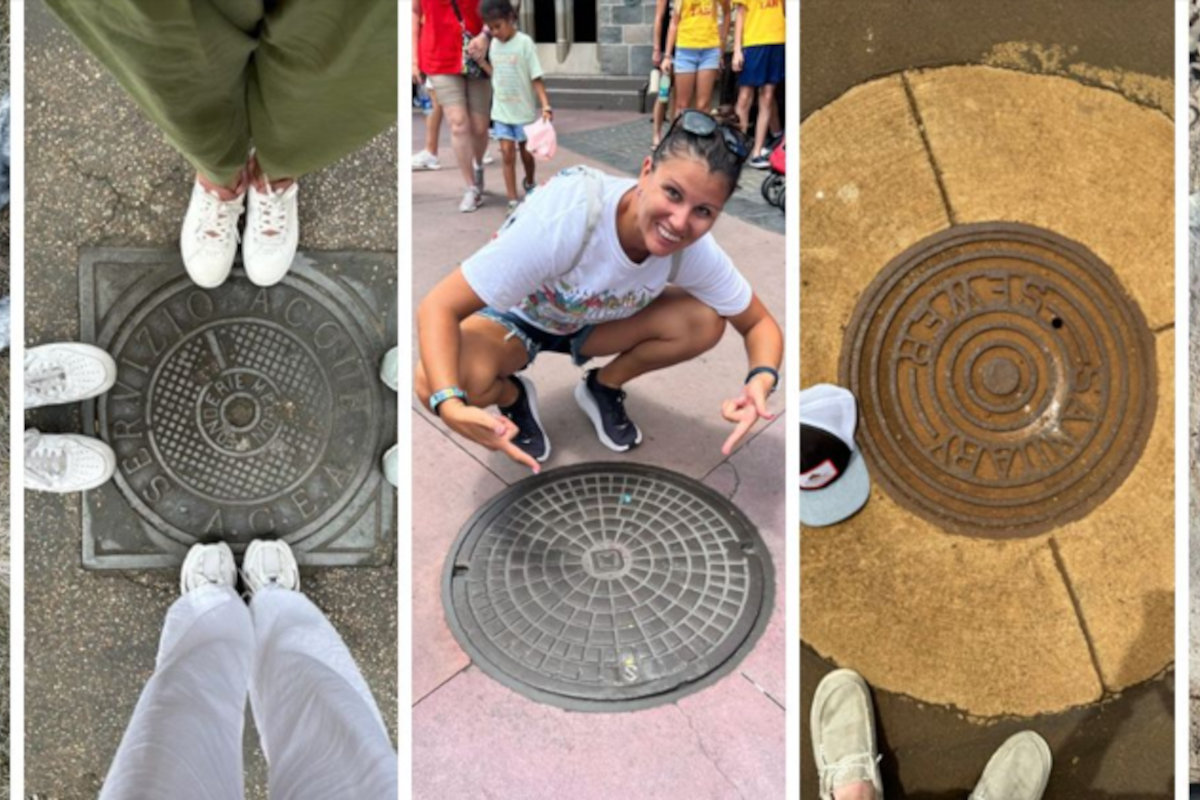
Using the CUES Spider, RH Borden’s team can create a 3D scan of a manhole. Here is a flattened image of one of those scans as the Spider descends below the surface.
Barriers to Growth
On the flip side, there are barriers that RH Borden has had to overcome in the last two years.
“We are pitching the manhole scans as a service model. The reason that we see people not pulling the trigger on manhole scanning is the cost of entry,” Borden says. “That’s been a barrier, but when a company like RH Borden can come in and do that and a city does not have to make a capital purchase, cities are more open to it.”
Another challenge is a matter of prioritization — or lack there of. This creates a tailspin that is hard to recover from as infrastructure fails.
“If cities don’t properly prioritize, they can fall behind in infrastructure management. If a city is known for having poor infrastructure — because they are behind — it brings fewer people and businesses,” Borden says. “This equals a decreased tax base and ultimately equates to fewer dollars spent on infrastructure management. It’s tragic when that happens.”
To avoid that infrastructure downward spiral, a city needs to have a sustained budgetary approach to asset management. With the right data, they can get there.
There are two things that cities use the scanning for. The first, cities will fold this scanning into their overall asset management program to analyze the degradation of manholes and the structural integrity of manholes. Over time, that will be a lower volume [of scans] because the city knows where its high H2S lines are and then target future scanning onto those lines.
The second use case is cities that might be looking to update data on their manholes like dimensions, or confirmation of pipe sizes. This is going to be a greater volume of scans, but the cost comes down as more scans are completed. Oftentimes, Borden says, cities are looking for both.
The first step is getting baseline data using manhole scanning or the SL-RAT. The second step is returning in two or three years to get the second scan to see how the infrastructure is doing.
“With two data points, the owner will be able to see how frequently they should be looking at the system and it won’t be the same for all manholes,” Borden says. “In one set of manholes, they might see severe degradation from Year 1 to Year 3. In other manholes they will see no degradation at all. Those manholes can be placed on a longer schedule.”
RELATED: Beyond the Pipe – Overall Sewer Maintenance Program Integral to System Health
The Future is Here
Looking down the pipeline, Borden sees similar scanning technologies coming to the pipeline assessment world. Some of those technologies are already here, and it’s a matter of finding the right one for RH Borden’s needs. “As those come to market, we will certainly be at the forefront of procuring that and working with partners to collect the data and process the data ourselves to deliver it to our customer cities,” he says.
He notes that the future also includes larger data files that require secure storage, and much of the data will be stored in the cloud. Being in the cloud brings up questions of security and cost. This will require more advancements to come in the data storage and management space.
On the personnel side of the equation — because even with advanced technologies and A.I. people will still be required to do the work — field teams will have to refocus themselves on doing different types of work. For example, acoustic assessments forgo the need to use a cleaning truck all the time. However, a city will still need the team to collect the data with the acoustic tools.
“We will see a shift from tools that don’t yield data [a vac truck] to tools that do yield data. Cleaning trucks will be in play, but they will be a secondary player to what the data will tell us,” Borden says. “Historically, this industry has been focused on time-based maintenance. Data will tell us where to take our trucks to clean as opposed to just a time-based schedule. Condition-based maintenance will be the trend of the future as data gives us more insights.”
The move to a data-driven tech future is inevitable, and the industry will see a need for increased education – both for potential customers and field technicians. That doesn’t necessarily require a college degree, but a high-level of technical training is required. To that end, Borden spends time talking to municipalities, colleges and universities to create the next generation of field workers. These workers need to be trained on data collection and be familiar with working on mobile platforms and online dashboards.
“The worst thing that can happen is that all of this data will be online, and people will be displaced from their employment because they don’t know how to work with it,” Borden says. “We really want to have, for our society, to be successful and have great opportunities. But people need to sharpen the saw when it comes to understanding the data. They can’t deny the data anymore.”