Using Vendor Benchmark Data to Determine a Cost-Effective Leak Detection Program
The typical municipal procurement process utilizes the age old “low bid” process. A detailed specification is created, and vendors provide a sealed bid. The low bid wins and the agency hopes it gets what it really wants.
This works with static products such as pipe or valves. For more complicated products such as membrane treatment systems it is more appropriate to use a life cycle cost process. The amortized capital cost, cost of operation, cost of replacement membranes and system production recovery can all be considered through a model to determine the lowest cost of production.
It can be argued that selecting a leak detection program is even more complicated, and many more parameters must be analyzed to ensure the most cost-effective approach is used. The key performance metrics that can be used to determine the best fit are cost per leak found and marginal cost of new supply (recovered lost water).
Leak detection programs are varied in their upfront investment requirements, operating costs, and performance. All of these parameters impact the overall cost of finding leaks. The upfront investment costs are usually associated with some type of leak pre-location analysis.
There are multiple analysis technologies: fixed base acoustic systems, data-as-a-service products, software-as-a-service products, district metering solutions and digital twin virtual DMA’s. These techniques have two things in common: they are pre-location functions that lead the utility to areas where there are more likely to be leaks in the system and, they require a pinpointing activity to specifically locate the leak so crews can repair it.
The costs for these pre-location products/services can vary by a factor of 2, between $500 per mile (300 EUR per kilometer) and $1,000 per mile (600 EUR per kilometer). Their efficacy can also vary significantly with some being exceptionally good at locating leak cluster areas and others not so much. This can vary by a factor of 13; between six leaks per 100 miles (four leaks per 100 kilometers) to 80 leaks per 100 miles (50 leaks per 100 kilometers). These two parameters contribute to the first part of the cost per leak found metric.
The second part of this calculation is the pinpointing activity. Once an area is located where it is determined there are clusters of leaks a technique must be deployed to pinpoint these leaks so they can be efficiently repaired. There are multiple techniques to accomplish this task, including traditional boots-on-the-ground acoustic leak detection crews, in-situ probes and electric current based systems.
These costs can vary by a factor of 10, from $100 per mile (65 EUR per kilometer) physically inspected to $1,100 per mile (700 EUR per kilometer). They also have high technical efficacy variability from finding 0.3 leaks per mile (0.2 leaks per kilometer) to 2.8 leaks per mile (1.7 leaks per kilometer). The efficacy of the pinpointing activity is dependent on the pre-location efficacy and the ability of the inspectors to detect leaks.
These two activities combined can allow a utility to estimate the cost to find a leak. Finding leaks is the first step in understanding the true value proposition. The last step is knowing what types of leaks are found and if they are non-surfacing or visible.
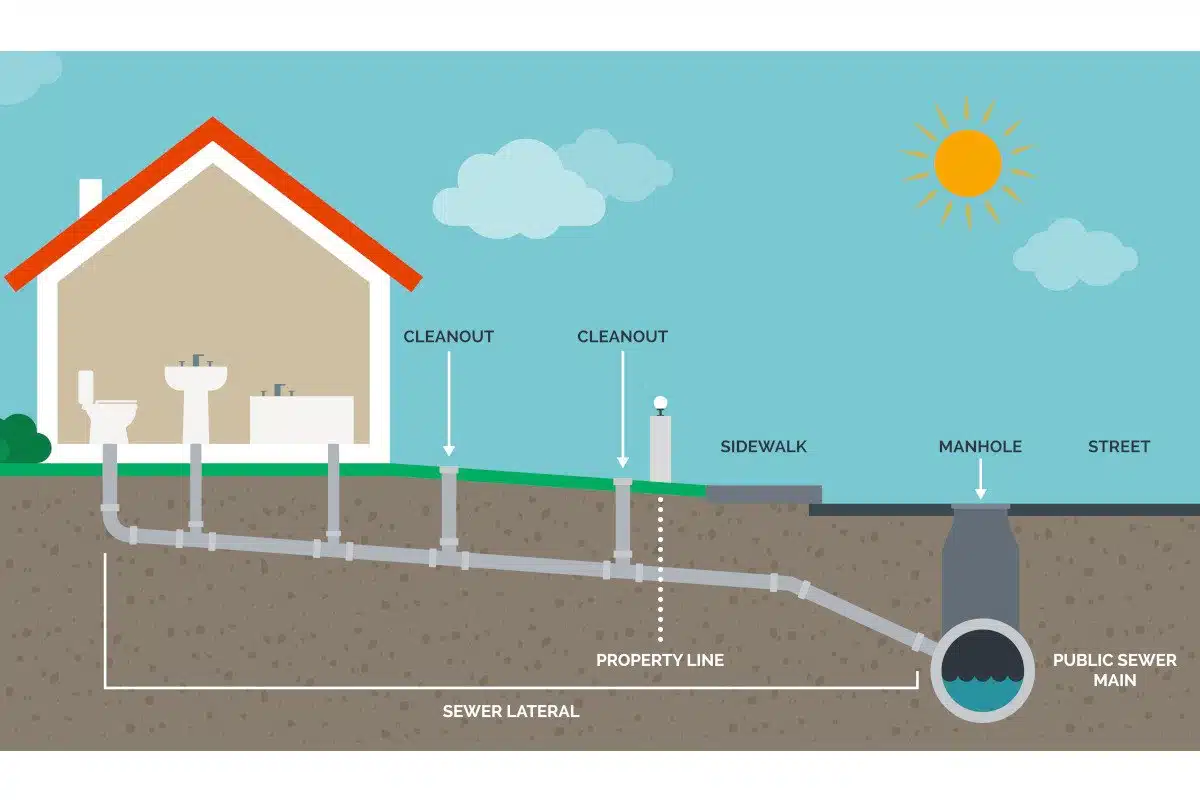
There are seven major leak sub-types; main pipe, service pipe, connections, valves, hydrants, curb stops and meters. AWWA Manual M36 lists projected leak sizes for each leak sub-type ranging from 10.4 gpm (0.65 liters per second) for main pipe leaks to 3.5 gpm (0.22 liters per second) for hydrant leaks.
The types of leaks found by the vendor’s system are an important factor in analyzing the marginal cost of recovered water. Average project leak sizes can vary by a factor of three.

The best performing system will have a low cost of pre-location, a low cost of pinpointing, a high number of leaks found per unit system distance and a large average size of leaks found. It is relatively easy to create an excel-based model to analyze the expected cost to find a leak and the marginal cost of recovered water.
The largest variable that contributes to the cost effectiveness of a program is the leaks found per mile, or per crew day, and the size and types of leaks found. For a program that has a combined service cost (pre-location investment and pinpointing) of $1,200 per mile (780 EUR per kilometer), $1,000 per mile investment and $200 per mile operating, the marginal cost per 1000 gallons (3.8 cubic meters) recovered can vary by 21 times.
At the low end of the spectrum, if 0.3 leaks are found per mile and the average leak size is 2 gpm, the cost of the recovered water is $3.40 per 1,000 gallons (13.6 EUR per cubic meter). At the high end of the spectrum if 2.8 leaks are found per mile and the average leak size is 5 gpm the cost of the recovered water is $0.16 per 1,000 gallons (0.64 EUR per cubic meter).
Utilities must ask the vendor to provide benchmark data on the performance of their system in comparable applications. The benchmarking data should include:
• Cost of Pre-location Investment
• Life of Investment
• Cost of Pinpointing
• Leaks Found per Mile of System Length
• Distribution of Leak Sub-types Found
Vendors should have this data readily available for review by the utility. The more robust that data provided by the vendor the easier it is for the utility to benchmark expected performance and value proposition.