The Road to 3D is Paved with Good Intentions that Can Deliver when Visualization Meets Reality
It is not many years ago the novel concept of below ground 3D representations of utilities permeated into companies on the forefront of Subsurface Utility Engineering (SUE). This concept was driven by several factors one of which is the robust computing power adopted from BIM used by structural and design engineers. Firms engaged in the SUE standard for designating and depicting utilities may also offer ancillary design services while some were just forward thinking and aware of adjacent technologies and processes and had the vision to apply them to the underworld of utilities.
As it stands today, the next driver is yet another daughter product of the rapid advances in computer tech and that is Augmented Reality (AR) and Mixed Reality (MR). The latter is AR with actual site conditions superimposed. The use of AR and/or MR for utilities underground can also be attributed to the BIM community as some of the earliest examples of Microsoft HoloLens, which arguably leads in this arena, involved buildings and mechanical designs as well in 3D. These virtual designs are viewed through special optics such as the HoloLens.
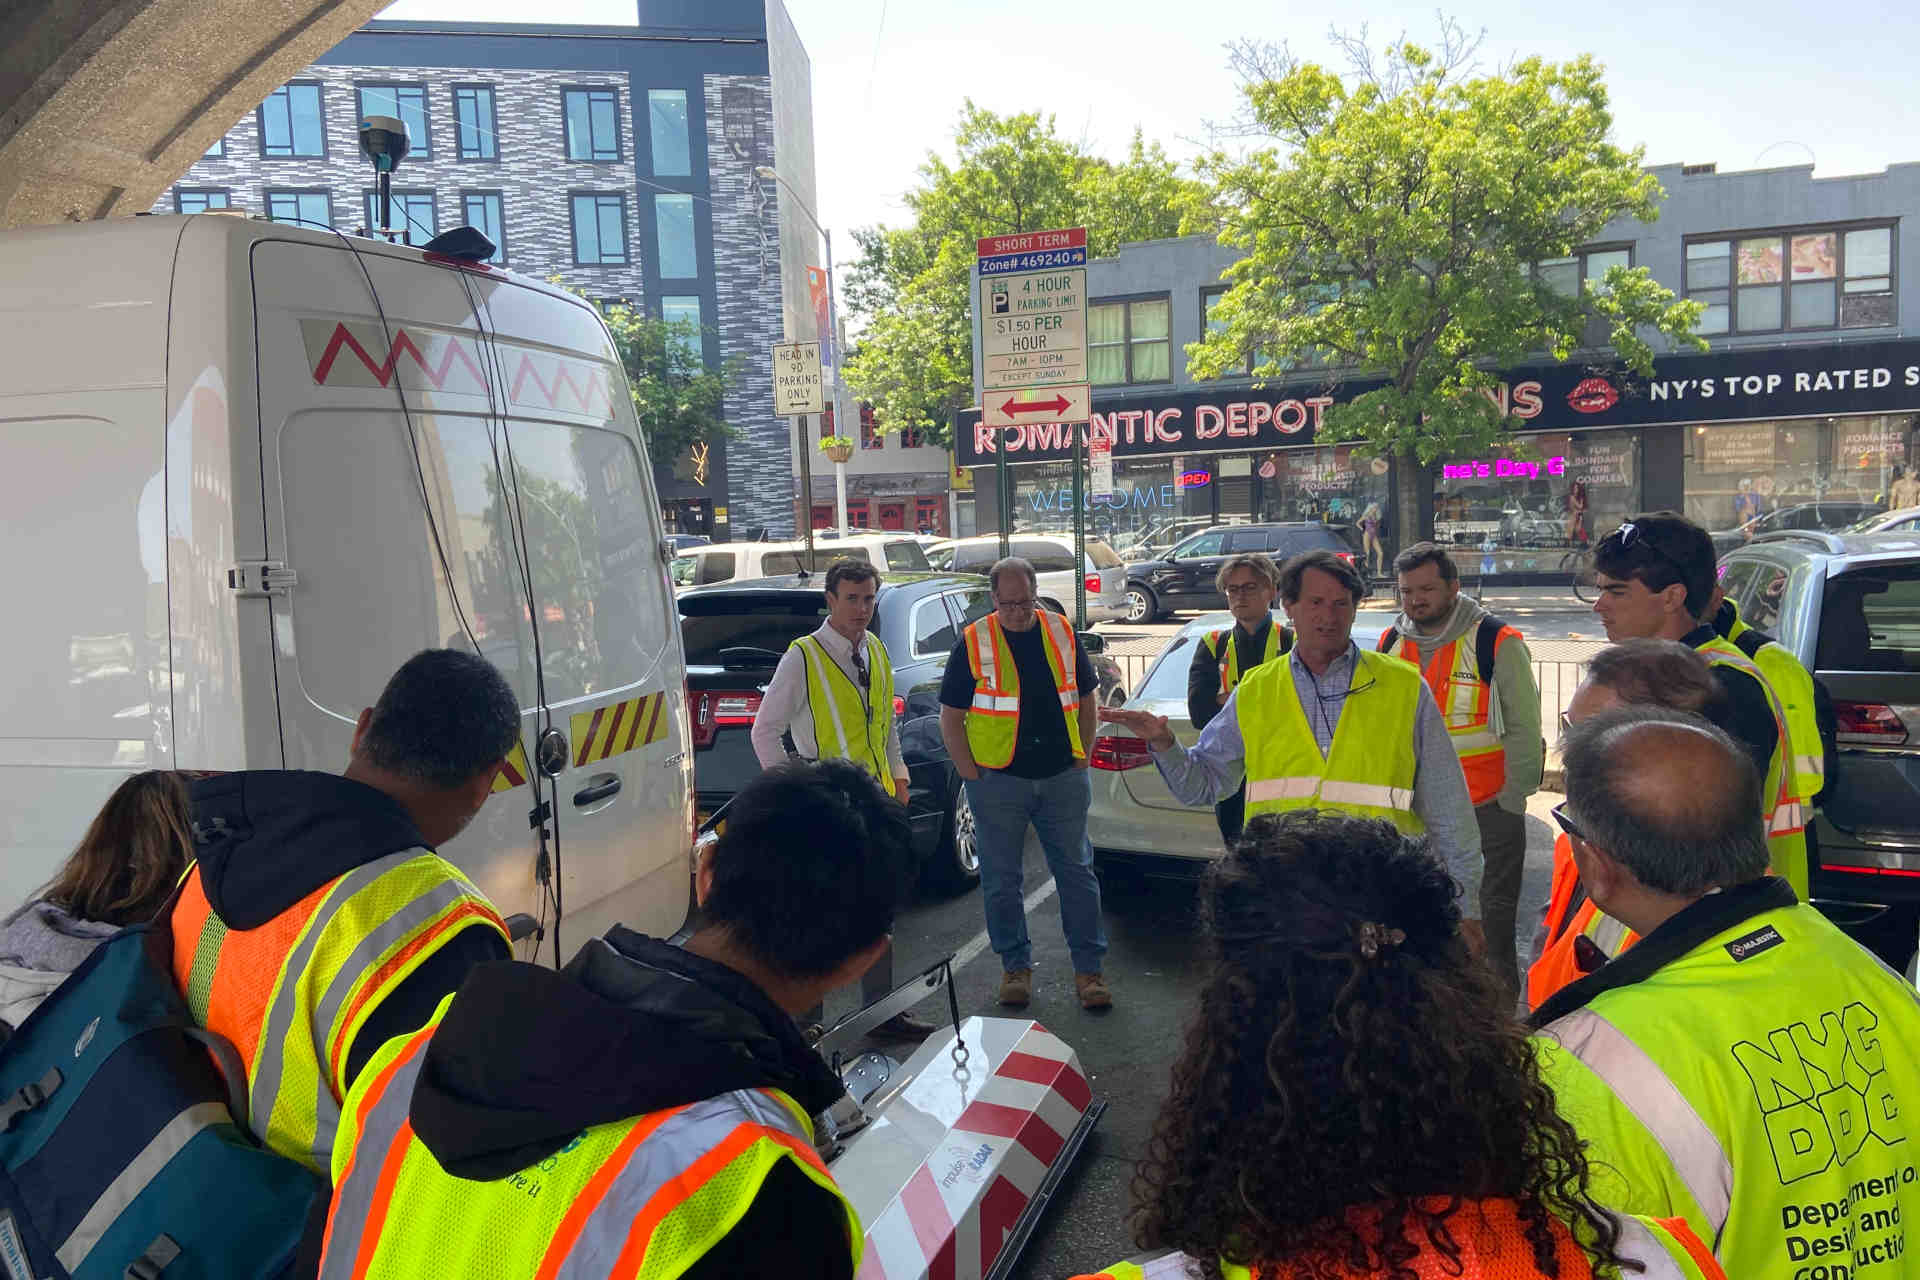
To bridge the final technology gap, the design engineer and the construction contractor, whether for an HDD install or surface installation along the corridor, can benefit from visualizing the data in AR/MR. Today, these data can be uploaded and visualized on several mobile devices including phones, tablets, or the HoloLens visualization tool itself. Online searches reveal many references to 3D software platforms that can be uploaded from both GIS and CAD platforms. This is exciting but this enthusiasm must be tempered with reality and that is the information on the device is only as good as the model behind it. The same careful approach to collecting the information for 2D SUE deliverables is necessary for any 3D model. Many early adopters to these visualizations are ardent practitioners of ASCE 38-02, which is scheduled for a major update to include the standards for the collection and depiction of 3D underground utility data. James Anspach, Distinguished Member of ASCE, Chair of ASCE 38, as well as past President of UESI who is spearheading the 3D standardization effort, recognizes the value of Mixed and Augmented Reality but emphasizes the importance of following a standard to ensure the input is of a certainty consistent with the goal of the visualization. Anspach explains; “We all need to beware of concepts of digital twins-but twins can be fraternal or identical and there is a world of difference. If we can’t make these digital twins as approaching identical, we need to know the source and quality of the source data. Heck, most AR visualizations I see at this point are closer to cousins that even fraternal twins.”

This is not disparate from what is already established for a paper drawing on the conference table or hanging on the field office wall. The importance of the quality level does not change simply because there is a visualization on a mobile device.
Getting quality data into these models is getting a much-needed boost in the updated ASCE 38 standard and the timing is perfect to converge visualization tech with a source that can meet reality. Any visualization platform needs to disclose the quality level of the information in the MR lens. For example, holding a tablet and looking at a beautiful representation of the underground utilities extracted solely from Quality Level D records research would be extremely unwise as a supplement to Quality Level A data when boring a congested corridor! Reality will find its way to the boring and the utility in short order!
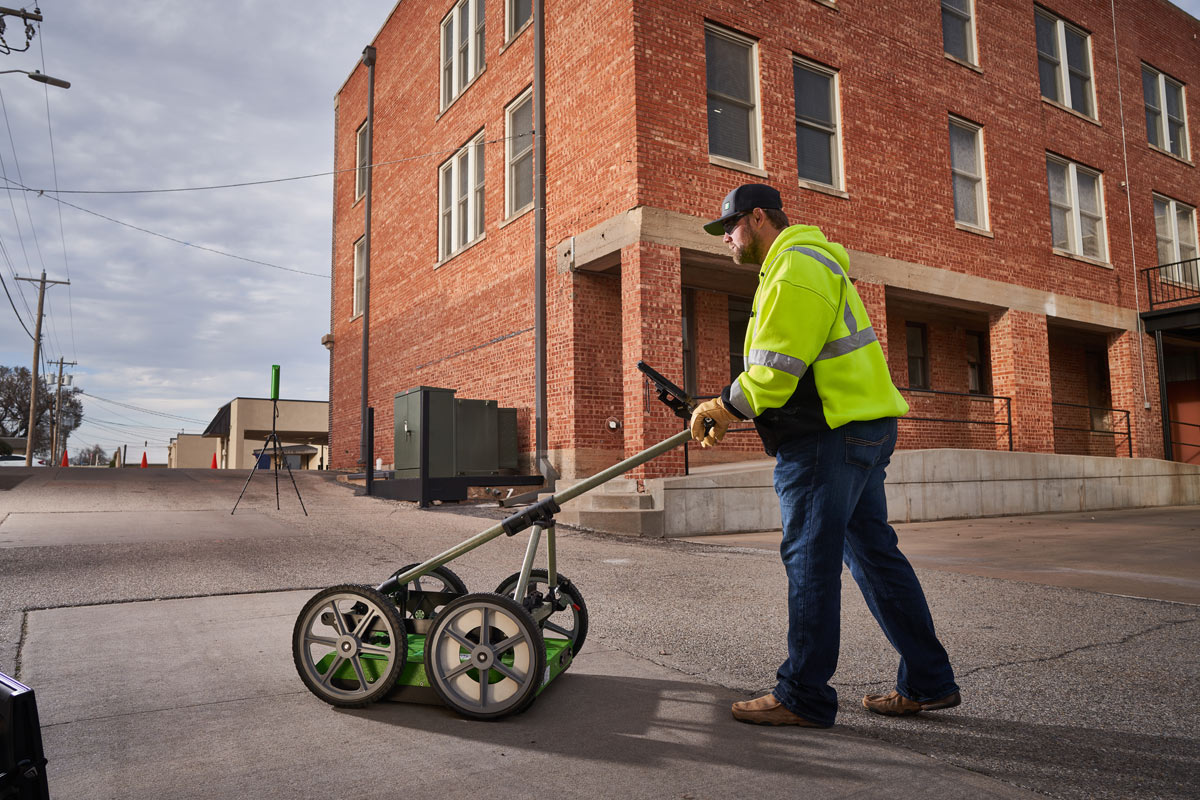
Much has been written in the last 18-months about high-speed GPR arrays like the Raptor array, which very gratuitously similar to Glamorous Glennis broke all speed records for its representative technology i.e., GPR vs aircraft. Although the first Swedish engineer to drive the vehicle with the Raptor array and collect 3D data will never have a movie or get to write a biography as Capt. Chuck Yeager did it is still a big leap (and yet another aeronautical reference). The Raptor paradigm shifted the collection of 3D GPR data as a vehicle with the array mounted to its receiver hitch can simply drive with the flow of traffic to collect data swaths the width of the vehicle.
Miles of street corridors can be mapped in 3D in short order. However, data visualization software tools for the 3D GPR arrays like the Raptor did not meet the reality of the typical SUE firm in terms of competitive bid costs and staff to handle the data. Processing was relegated to the resident geophysicist or engineer that took a keen interest and learned how to process the data from overly complex processing schemes. These individuals also typically billed at a high rate thus driving the cost of the deliverable a bit out of range for the client even though significant value is in fact realized. Software to convolve the efficiency reality is the next logical step.
To augment the rapid and simple collection of the high-speed array technology much like BIM, new advanced visualization software platforms that process 3D array data in a fraction of the time, and with a skill level more akin to a CAD tech rather than an engineer are available. Condor 3D array processing software for the high-speed Raptor array reduces processing time from previous solutions by more than a third and as well has simple efficient workflows tailored to the SUE professional. Of course, as with the CAD/BIM technician is to the structural engineer so too is the processing technician of the GPR array data to a responsible person in charge such as the geophysicist, engineer, or professional land surveyor. These licensed persons are likely mandated by your state or local licensing boards.
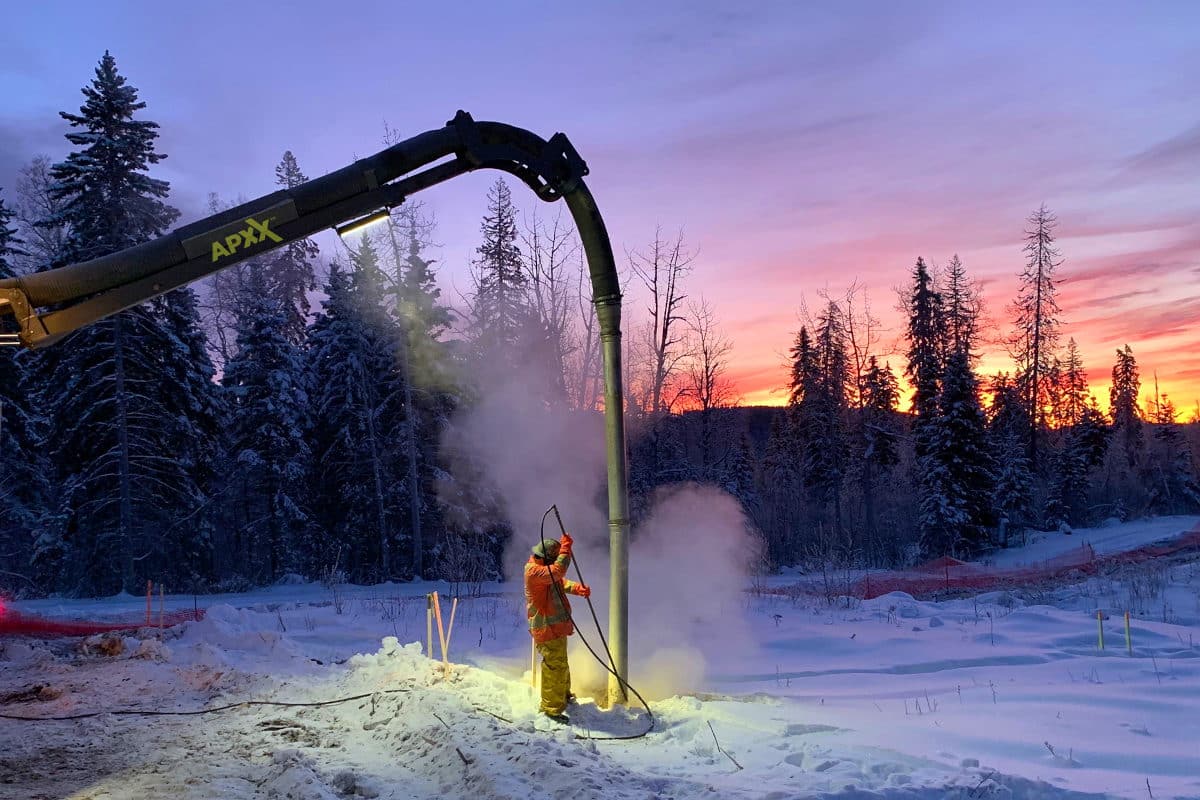
It is important to understand that the final visualization of any street corridor must always be a combination of data/survey inputs from the GPR array, 2D GPR data, EM designation, inventory of surface utility assets, records review of any existing as-builts or other historical data, and ultimately vacuum excavation at critical conflict areas. These criteria are well established in the ASCE 38-02 standard and proven to reduce project costs. Also, the final assemblage of these data for the AR/MR platform will be from CAD or GIS products.
The very idea of viewing the underworld on your phone or tablet is exciting but all stakeholders need to be assured that what you see is not a mirage but augmented or mixed reality one can believe approximates what truly exists to the degree the data input will allow.