How to Develop a Cost-Benefit Analysis for Pipeline Rehabilitation vs. Replacement
Pipelines are essential assets for water, wastewater and energy systems. Over time, they deteriorate due to corrosion, material fatigue and external factors such as soil conditions and traffic loads. When performance declines, infrastructure managers and utility operators often face a critical decision: whether to rehabilitate aging pipelines or replace them entirely.
With rehabilitation, you are restoring the structural integrity of an existing pipeline using methods like cured-in-place pipe (CIPP), slip lining or spray-in-place pipe (SIPP). Replacement would mean you are removing your existing pipe and installing a brand-new pipe that is made with more modern materials and improved design standards.
The decision hinges on balancing initial rehabilitation/replacement costs, long-term maintenance, risk of failure, consequence of failure and expected service life. This choice impacts not only immediate budgets but also long-term operational reliability, environmental compliance, and customer satisfaction.
A comprehensive cost-benefit analysis provides a clear solution for making this decision. Below is a summary of the key steps, considerations, and tools for determining whether it is best to rehabilitate or replace your aging pipelines.
Step 1: Define the Scope
The first step is defining the scope of the project you wish to analyze. Start by documenting:
- Pipeline characteristics: Location, length, diameter, material, age and condition.
- Project objectives: Extend service life, restore structural integrity, reduce leaks, comply with regulations and/or minimize disruptions.
- Analysis horizon: Typically 20 to 50 years for lifecycle cost comparison.
Step 2: Identify Cost Components
The second step is to identify cost categories in the life cycle of an asset. These can include:
- Initial Capital Cost: Purchase, installation, permitting.
- Annual Operating & Maintenance (O&M): Labor, energy, routine repairs.
- Periodic Major Repairs: Scheduled rehabilitation or upgrades.
- Risk-Adjusted Failure Costs: Emergency repairs, downtime, penalties.
- Disposal/Decommissioning Costs: At end of life.
- Pipeline replacement generally has higher upfront cost but lower future maintenance.
Step 3: Estimate Benefits
The third step is to identify and quantify the benefits of rehabilitation versus replacement. Both options offer the following benefits, but they differ in scope, schedule, and material longevity:
- Reduced leaks and water loss = lower operating costs.
- Improved reliability = fewer emergency repairs and service interruptions.
- Extended service life = defer major capital expenditure.
- Regulatory compliance = avoid fines and penalties.
- Customer satisfaction = fewer outages and complaints.
Replacement is typically lower risk, while rehabilitation offers a quicker, less disruptive solution at a lower initial cost. Both solutions can offer similar service life, depending on the rehabilitation solution and the materials used.
Step 4: Quantify Risk and Consequence of Failure
The fourth step in a cost benefit analysis is to identify and quantify risk and consequence of failure. Risk assessment is critical to identify:
- Probability of failure after rehab vs replacement.
- Impact of failure of the system in question: emergency repair costs, service disruption, environmental damage.
- Safety and compliance risks: potential fines or liability.
It may be helpful to use GIS and asset management data to prioritize pipelines by condition and criticality.
Incorporate risk-based scoring to weigh financial and operational impacts that are calculated in other steps of the cost-benefit analysis. Rehabilitation often carries a higher residual risk because the original pipe remains in service, whereas replacement significantly reduces failure probability.
Step 5: Calculate Lifecycle Costs
Calculating lifecycle costs involves summing all costs associated with an asset over its entire service life, adjusted for the time value of money.
Net Present Value (NPV) is a financial metric used to determine the value of an investment or project by calculating the present value of all expected future cash flows, discounted back to today, minus the initial investment cost.
Use net present value (NPV) to compare project options:

Where:
Ct=Cash inflow (or outflow) at time t
r=Discount rate (reflects the cost of capital or required rate of return. This is typically 3 to 5 percent)
t=Time period
C0=Initial investment (usually a negative cash flow)
Include initial cost, annual O&M and risk-adjusted failure costs.
This approach ensures that future costs are properly discounted, allowing for an apples-to-apples comparison.
Step 6: Compare Scenarios with a Decision Matrix
A visual decision matrix simplifies comparison:
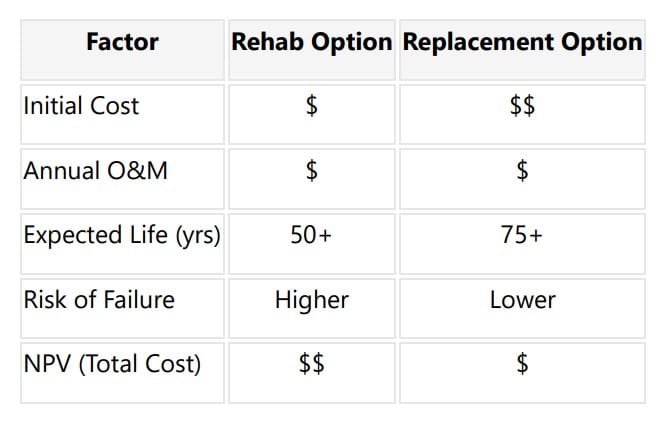
This matrix highlights trade-offs: rehabilitation is less expensive upfront but generally has a shorter lifespan and higher risk, while replacement costs more initially but generally offers longer-term stability. There are, of course, exceptions to this rule and each project and scenario should be looked at independently.
Step 7: Perform Sensitivity Analysis
Once you have gathered all the information for each option and populated the decision matrix, you can then test how changes in assumptions can affect results. For example, how would the analysis shift if you vary the discount rate (e.g., 3 percent, 5 percent, 7 percent), adjust failure probability and repair costs or consider material price fluctuations.
Sensitivity analysis ensures the decision remains robust under different scenarios.
Step 8: Decision Criteria
The final step to development of a cost-benefit analysis is to set and weight decision criteria. This will help you determine which factors are the most important to your particular municipality or utility and inform which solution best meets your organization’s goals. The best option for each individual project depends on:
- Lowest NPV cost over the analysis horizon.
- Acceptable risk level for your organization.
- Strategic alignment with goals like sustainability, resilience, and regulatory compliance.
Conclusion
Choosing between pipeline rehabilitation and replacement is more than a financial decision — it is a strategic choice that affects reliability, safety, and customer trust.
A structured cost-benefit analysis, supported by lifecycle costing and risk assessment, provides the clarity needed to make informed decisions. It provides the information needed to communicate effectively with community members, decision makers, and other partners using clear visuals and cost summaries for each alternative.
By combining quantitative analysis with visual tools like decision matrices, utilities can confidently select the option that delivers the best long-term value.
Jennifer Glynn, P.E., is senior technical practice lead at Woodard & Curran.
Latest Posts
- City of Newark Goes Trenchless to Repair Historic Pequannock Aqueducts

- NUCA Convenes in Tucson for 2026 National Convention
- Product Showcase – Denso Archco 456
- DCA Holds 65th Annual Convention in Miami
- How Is the Trenchless Rehab Market Faring in Today’s Economic Climate?


Next Up
2026 Microtunneling Short Course | May 5-7, 2026 | Scottsdale, Arizona | Learn more