Product Profile: Lateral Mapping
Tracking the Laterals Gives You a Better Picture of What Is Underground
As technology improves so does the demands of the market for improved inspection methods, data collection and enhanced mapping capabilities. Looking at our industry specifically, requests have increased for more accurate mapping of underground infrastructure. Over time the process and methods for mapping has evolved greatly from “as built” and paper mapping to computer stored CAD drawings and geographic information system (GIS) mapping.
When creating GIS maps, the points are usually collected using a global positioning system (GPS). Using the GPS coordinates of two manholes connected by a pipe the GIS mapping technology can draw an estimated line for the position of the mainline. The position of the mainline has had to be estimated since GPS coordinates of the asset underground cannot be collected underground. Knowing that the satellites cannot communicate with the sensors, some software vendors have begun estimating GPS coordinates for some defects and service connections based on distance traveled between the two confirmed points. This information has been the most accurate available until more recent technologies have evolved.
RELATED: A Look at Laser Pipe Profiling
Tracking Laterals
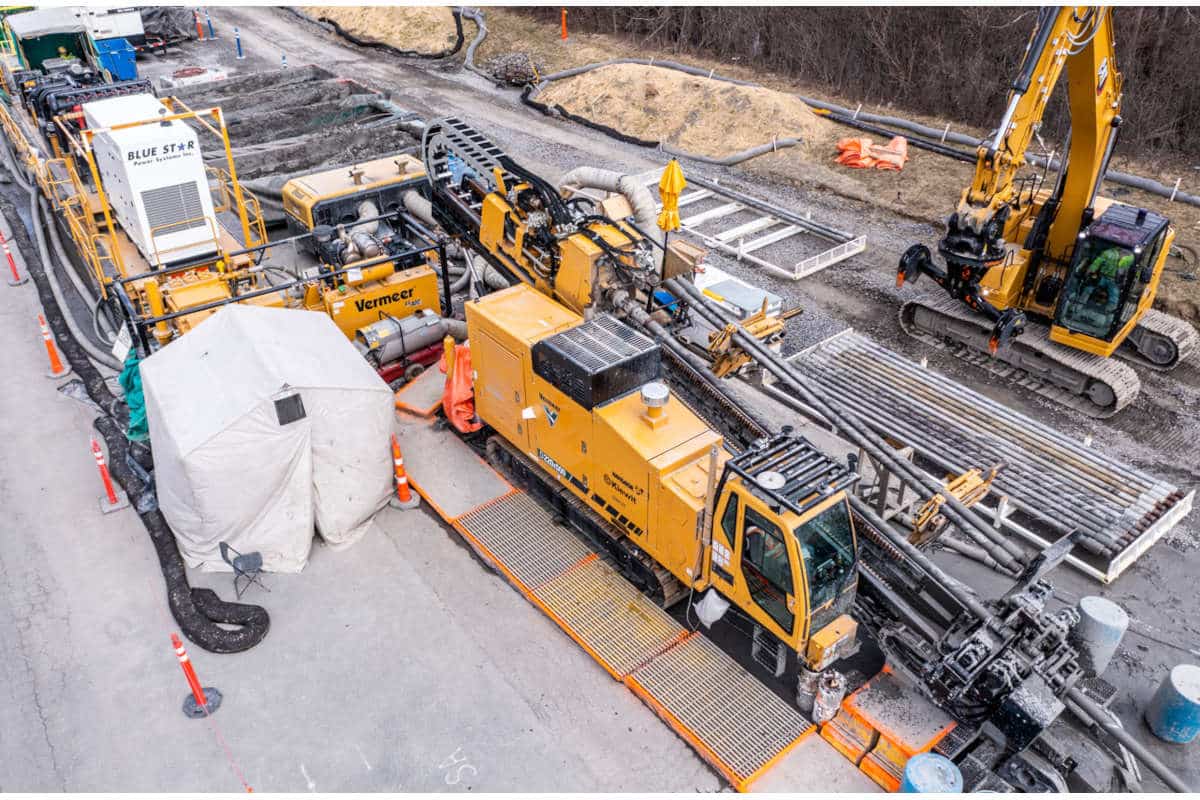
Tracking the laterals is another story all together. They are typically not laid in straight, and often have bends and wye connections as they connect the various services to the sewer main. Only having an estimated entry point for the tap and a captured point for the cleanout does not yield information guaranteed to be accurate enough to work with. On top of that, with the increased use of horizontal directional drilling (HDD) and other upgrades to utilities, knowing the precise location of the laterals has become paramount within the industry. The demand for knowing XYZ coordinates is increasing for both the main and laterals.
Now there is technology that can get you extremely accurate information as to the position of your underground assets. Tracking the path of the main and the lateral using integrated sensors that monitor direction, drift, distance traveled and changes in grade are able to give a 3D view of where everything is underground. These systems are able to achieve an extremely high level of accuracy 99.95 percent helping to create an extremely detailed map of the underground infrastructure. These sensors integrated into the Rausch M-Series Lateral Launch with the LATRAS (LAteral TRAcking System) are capable of giving extremely detailed mapping of both the main and the laterals from a single manhole entry.
The first step is simpler if you have an existing GIS and your confident with the accuracy of the maps. You want to have your known GPS points from both upstream and downstream manholes to tell the system that a segment connects between them and it draws a line between the manholes. Most cities have a GIS mapping that can be brought into the inspection vehicle. With the GIS mapping the user can select the asset to be inspected and it will bring in all the current historical data for that asset such as size, material length and other important information. The operator would then verify the existing information to ensure the new data is as accurate as possible.
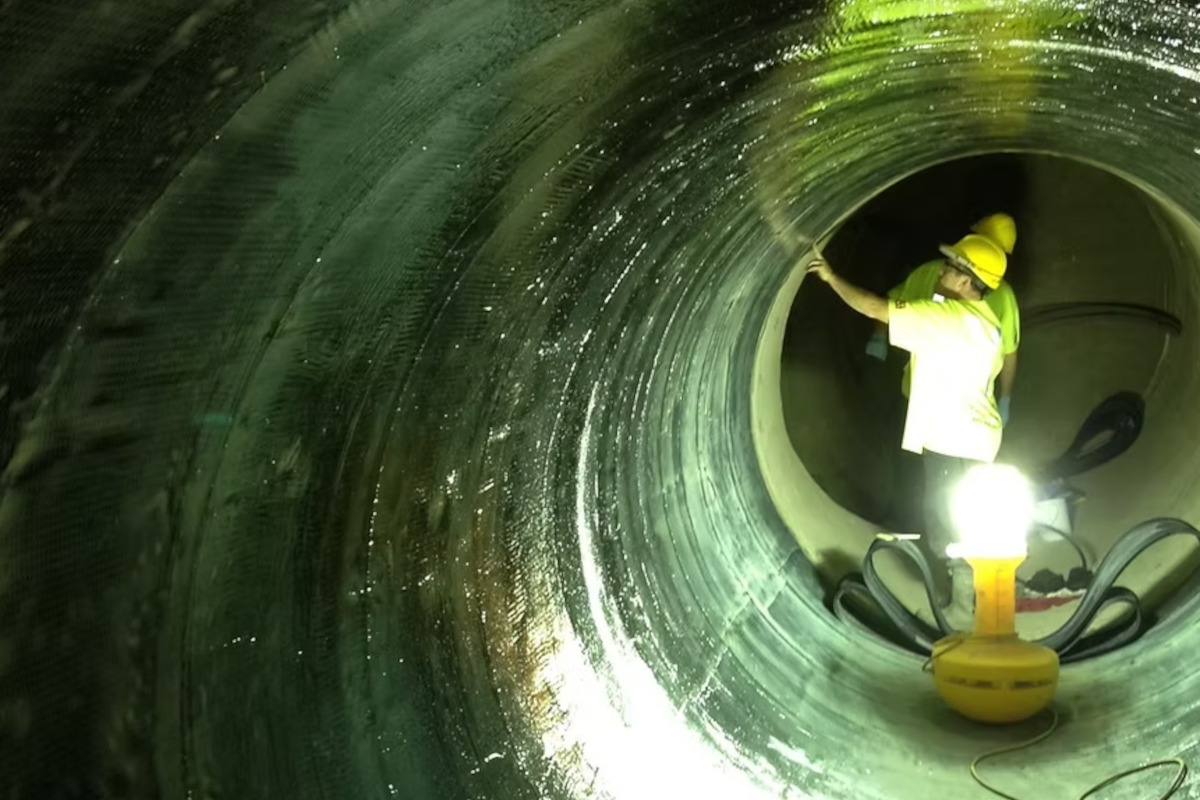
Then, the inspection crawler is lowered down the manhole to navigate the mainline from end to end for a standard video inspection. While it is navigating the pipeline, the LATRAS sensors are sending hundreds to thousands of data points and drawing its path on the computer screen in real-time, allowing for verification and visual assurance that the system is recording all the data. This data, when used in conjunction with the inclinometer, will not only give a proper reference as to the true path of your mainline – maybe it was not laid in as straight of a line as you originally believed – but it will also clearly point out any sags in the line that may potentially cause issues with flow.
After completing the main inspection and data capture, you launch each of the laterals. The LATRAS sensor is connected to the lateral camera as it is launched up the lateral from the mainline. The system’s control electronics captures the direction and tilt movement of the sensor head and records the information with automatic data logging software. The inspection software then takes this data and maps out the path of the lateral out on a GPS plane on a real-time display connected to pre-existing GIS systems. The Rausch system enables the operators to perform a standard lateral video inspection from the mainline simultaneously with the LATRAS operation in a single run. This data – just as with the main -will be drawn on screen in real-time, charting the path of the lateral. The data collected is stored in the inspection software.
The sensor tracks the constant pitch and roll of the pipe as it traverses through the lateral line and can be steered up wyes and around bends from the main to the cleanout. This generates a complete outline of the entire sewer system beyond the typical manhole-to-manhole data entered into current GIS systems, which enhances the sewer system operator’s understanding of the volume within their network.
RELATED: Developing an Action Plan to Address Cross Bore Safety

Using true data for the manhole and lateral captured by a system and used in a mapping system allows for the most accurate mapping available.
Benefits of Lateral Mapping
Using true data for the manhole and lateral captured by a system and used in a mapping system allows for the most accurate mapping available. Here are the benefits of using lateral mapping:
1. Time savings: Having a true location of the asset and how it is laid underground will save an incredible amount of time and resources. I have seen crews look for hours with a probe in a yard trying to find a lateral based on the estimated position of the tap location and the clean-out.
2. Money Savings: When the XYZ data is captured and stored in the mapping system it’s there forever and as future projects come the data can be referenced for locations versus doing the locate or paying someone to do the locate for you.
3. Understanding: Being aware of how and where the mains and lateral are connected may give your crews insight into potential problems in an area.
4. Life Saving: Knowing where your services and mainlines are allow you to give accurate information to contractors working in the area. The data could potentially be used with cross bore gas line installations aiding in keeping the gas lines a safe distance from the pipes underground.