Water Main Breaks: U.S. & Canada
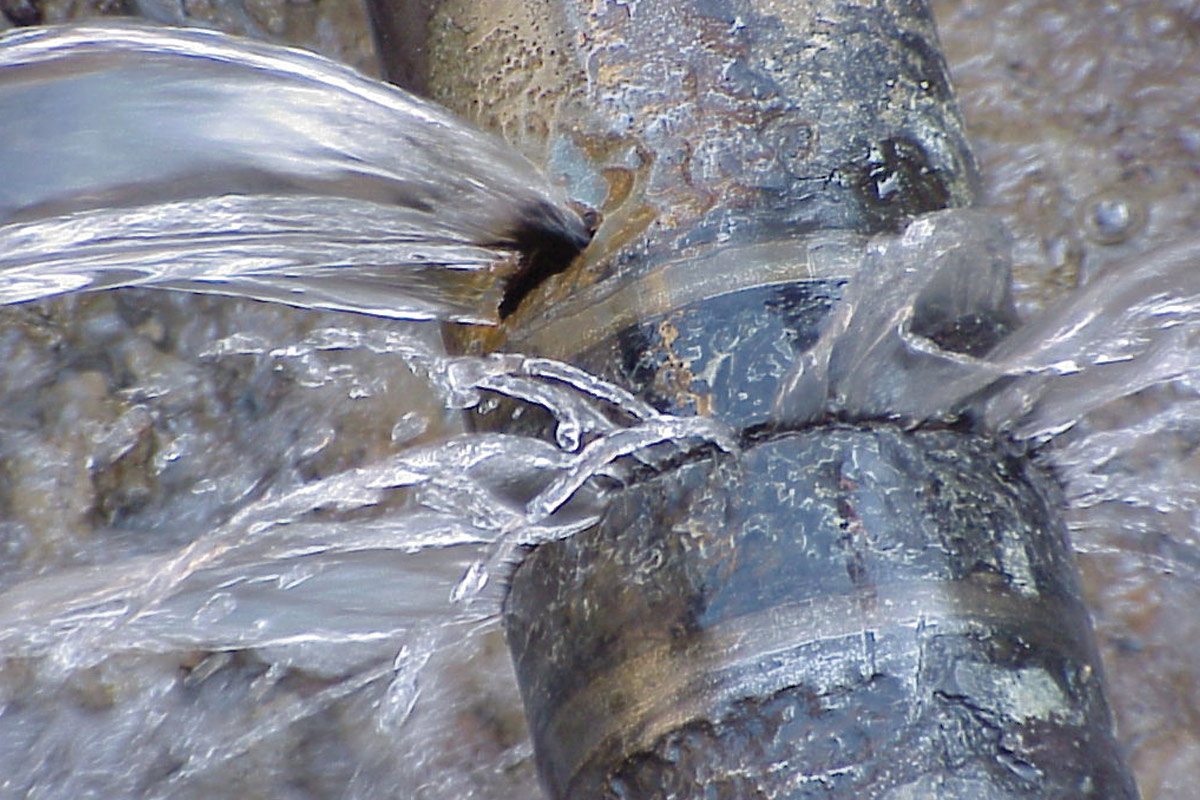
For all the out-of-sight, out-of-mind infrastructure we talk about in the water utility sector, water main breaks may be one of the more visible events that remind the public about the consequences of infrastructure failure.
Water main breaks can flood streets, damage roadways and property, affect traffic and commutes, create downtime for businesses and increase the risk of accidents. Main breaks can also impact the distribution system, affecting flow, pressure and water quality – not to mention the cost.
A study completed by Utah State University in December 2023 and published in February 2024 takes an in-depth look at water main data and break rates in the United States and Canada, analyzing failures against several parameters. It purports to be the most comprehensive data on water main failures to date, and examining the results may help inform future asset management programs in addressing breaks.
“Water Main Break Rates in the USA and Canada: A Comprehensive Study,” surveyed more than 800 utilities and analyzed about 400,000 miles of pipe data.
The study was completed by USU’s Utah Water Research Laboratory, a 113,000 sq-ft water and environmental research facility complete with multiple labs and field sites near the Logan River watershed in northern Utah.
Analyzing Utah State University’s Study
The water main break study is the third of its kind conducted by USU with previous versions in 2012 and 2018. The sample size for the 2023 study was nearly three times larger than the 2018 study.
The nearly 400,000 miles of pipe data analyzed represent about 17 percent of the approximately 2.3 million total miles of water mains in the United States and Canada. In terms of pipe mileage, it is the largest study in the United States and Canada of its kind.
Lead researcher Steven Barfuss, P.E., research professor at USU, says the goal was to take an unbiased look at break rates and associated factors, and identify indicators of failing pipelines.
Using population and pipe mileage numbers from the U.S. EPA, U.S. Census Bureau and Statistics Canada, USU says the study covers approximately 30.1 percent of the population and 17.1 percent of the water mains, providing a survey sample size that is both comprehensive and reliable. The proportion of small utilities surveyed for the study also increased from 68 percent in 2018 to 75 percent in 2023, which Barfuss says better reflects the actual number of these systems in the United States and Canada.
This is the first study to use the metrics of 2.3 million total miles, incorporating EPA and American Society of Civil Engineers’ updated figures on how many miles of pipe are in the United States (~1.9 million miles). Barfuss says the sample size has statistical significance and adds to the accuracy of the study.
“I think 17.1 percent is a very significant number in terms of a data set that can be analyzed to help utilities make better decisions,” says Barfuss, who has more than 37 years of research experience at USU’s Utah Water Research Laboratory.
The Magnitude of the Cost
Perhaps chief among the high-level findings of the data, the study found that the United States and Canada experience 260,000 water main breaks annually, representing $2.6 billion in annual repair costs.
This total was determined using EPA’s estimate of 2.2 million miles of pipe in the ground in the United States, plus Canada’s estimate of 133,000 miles of pipe north of the border, giving a total of 2.3 million miles of pipe.
In the survey responses from utilities that provided data, for all pipe materials and diameters, the average break rate per 100 miles per year is 11.1. Applying 11.1 breaks per 100 miles per year to 2.3 million miles of pipe, the result is roughly 260,000 water main breaks annually. If it is assumed that a single water main break repair costs an estimated $10,000 (direct and indirect costs), this represents $2.6 billion annually.
“I think one of the biggest takeaways from this study is that you can start to put volume to this, but also dollars to it,” Barfuss says. “It gives an umbrella-type summary of what’s happening in the U.S. and Canada.”
In USU’s 2012 study, utilities reported that only 8 percent of installed water mains were beyond their useful lives. The 2023 study shows that percentage has now increased to 19.4 percent, representing 452,000 miles of water pipes in the United States and Canada that are beyond their useful lives and need to be replaced but have not been due to lack of funds.
But how much does a mile of pipe cost? And how can we estimate the total cost of replacing 452,000 miles?
As Barfuss explains, using an estimate of approximately $1 million per mile (which may be high or low depending on variables), or about $189 per linear foot, the total funding shortfall needed to replace the 452,000 miles would be approximately $452 billion.
Pipe Age and Material
One survey question asked utilities the typical age of most water mains in their system when they fail: the average age was 53 years. Concurrently, 33 percent of all water mains reported in the survey were more than 50 years old. This suggests that about a third, or about 770,000 miles of water mains across the United States and Canada may be at or near the age of failure.
Cast iron and asbestos-cement pipes are no longer manufactured but are still in the ground and getting older. The study found a total of 86 percent of cast iron pipes are more than 50 years old and 41 percent of asbestos-cement pipes are more than 50 years old.
According to the study, material usage varies significantly across geographic regions, suggesting that selection of pipe materials is often based on preference.
In the United States and Canada, 90 percent of installed or in-service water mains are a combination of PVC at 29 percent, ductile iron at 27 percent, cast iron at 23 percent, and asbestos cement at 11 percent. The remaining materials (concrete steel cylinder, HDPE, PVCO, steel, other and unknown) each represent less than 3 percent.
The 2023 study shows PVC pipe length increased by 7 percent over 2018, ductile iron remained approximately the same, and AC and cast iron continue to be phased out.
Water Main Break Rates
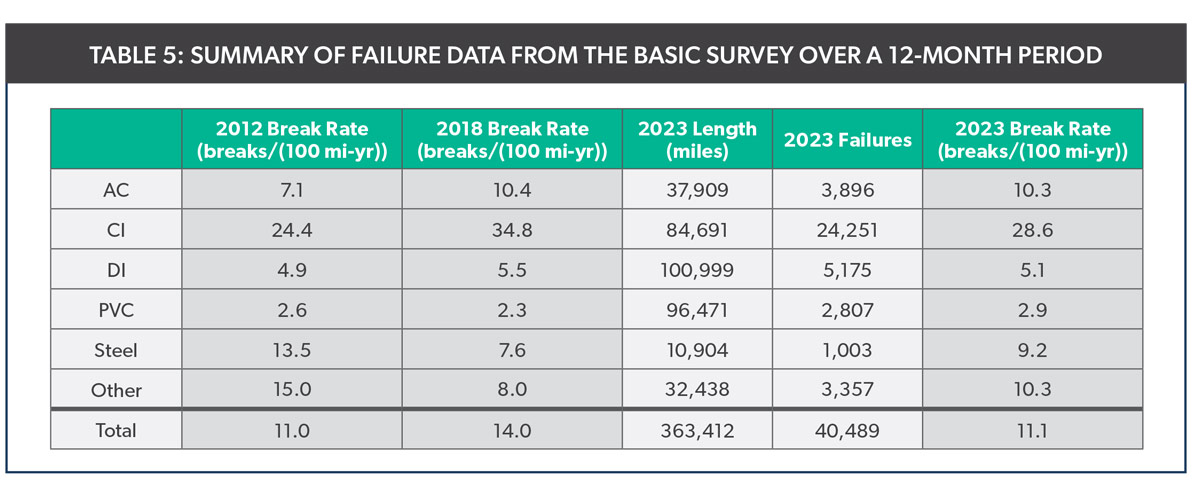
For the study, survey respondents were asked to consider a water main failure as one in which leakage was detected and repairs were made. Respondents were asked not to report failures due to joint leakage, construction damage or tapping of service lines, which are factors not indicative of pipe degradation.
Utilities provided the number of water main failures over both 12-month and five-year periods. The installed length of each pipe material was also included. The break rate was computed by dividing the total number of failures for a particular pipe material by its total reported length. The 12-month results are shown in Table 5 (abve) from the report, which also includes the computed 2023 break rates compared against the USU results from 2012 and 2018.
The 2023 failure rate of 11.1 breaks/(100 mi-yr) represents a 20 percent decrease compared to the 2018 USU study, which reported 14.0 breaks/(100 mi-yr).
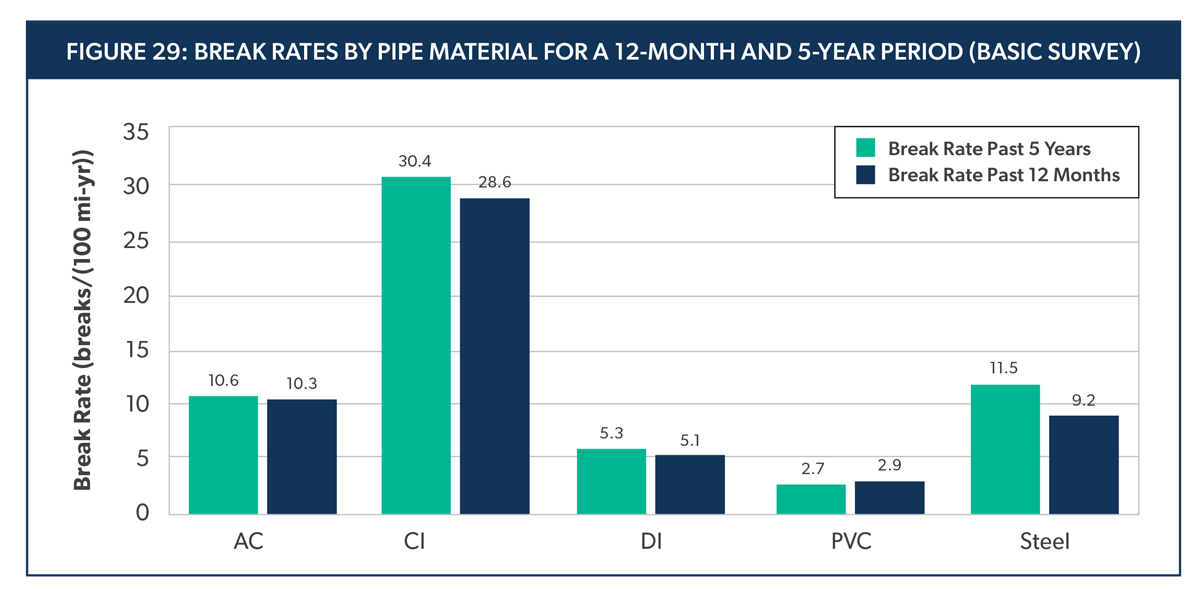
The relative break rates between pipe materials in the 2012, 2018 and 2023 surveys remain consistent, with PVC reporting the lowest break rate.
Notably, the break rate decreased for both cast iron and ductile iron from 2018 to 2023. USU says this is likely because the worst performing pipes have been replaced.
Figure 29 (above) shows the break rates among primary pipe materials over the past 12 months and the past five years.
The survey asked utilities for information on the size of different pipe materials in their water systems and corresponding break rates. Overall, the study found that the break rate for all materials decreases as pipe diameter increases.
USU found that about 86 percent of all miles of water pipes are 3 to 12 in. in diameter, and a total of 68 percent are 3 to 8 in. in size.
The USU study also examined break rates in corrosive soils. One finding here from ductile iron was that DI in highly corrosive soil (corrosion index of 3.0) will have a break rate about six times greater than one in low corrosive soil (corrosion index of 1.0). This is notable as USU’s 2018 study showed DI’s break rate to be 10 times greater in highly corrosive soil.
A new 2023 finding adds some light to this. While 75 percent found corrosive soil conditions, 73 percent of utilities reported using some form of corrosion protection with polywrap and cathodic protection as the most common methods. 70 percent of the utilities have a pipe replacement program and 44 percent do some form of regular condition assessment. Barfuss points out that even though 73 percent of utilities in this report said they use some kind of corrosion protection like polywrap and/or cathodic protection, the reported break rates for CI, DI and steel in this study would have been much higher if pipe wall thickness was part of the research.
Asset Management
In some other interesting findings, the survey also asked about water loss due to leakage. A total of 530 utilities provided an estimate of their water loss due to leakage and the average reported value was 11 percent as compared to 10 percent reported in 2018. The study also showed little correlation between break rates and utility size.
Barfuss says his hope is that utilities can use this report to assist with asset management and facilitate water infrastructure planning.
“What USU hopes to accomplish with these reports is to help people understand water main break rates,” he says. “If I were a utility owner or utility manager making decisions about pipe materials, I would consider break rates as one of the criteria for my decision. Obviously, cost would be part of that too, and there are several variables associated with asset management decision making.”