Hamilton, Ontario Adopts New Hydrant Technology to Monitor its Water System
The City of Hamilton, Ontario has one of the oldest and most complex water distribution systems in Canada serving over 560,000 people.
Maintaining a consistent operating pressure is a difficult undertaking due to the Niagara Escarpment (300-ft elevation) that bisects the City into upper and lower elevations. The City is known for leveraging innovative technologies to enhance its water distribution system, giving rise to its latest pilot project using hydrant.AI technology developed here in Canada.
“We were interested in exploring technologies to monitor pressure in our distribution system in real time. This would provide insight into what was taking place in the piping network on a continual basis between pumping stations and storage facilities, as well as portions of the network served exclusively by pumping stations,” said Peter Nikolica, superintendent water distribution for the City of Hamilton. “In addition, around 35 per cent of our pipes have been in the ground for more than 70 years, as system pressure and leakage are related, we were also interested in early leak detection technology.
The City had a pressure monitoring program that relied on routine manual checks from pressure loggers, and SCADA-based monitoring at strategic points like pumping stations and water towers. While effective for basic monitoring, these methods didn’t provide the real-time, comprehensive data needed to pinpoint subtle fluctuations across the network.
The City’s water distribution system is divided into 24 pressure districts that are both open and closed.
In an open district, continuous pumping is not required to maintain pressure due to the provision of floating storage, like an elevated tank or reservoir.
Installing hydrant.AI Data Loggers in Hamilton, Ontario
In a closed district, continuous pumping is required to ensure that the required flows and pressures in that portion of the distribution network are met. The City initiated a new advanced pressure monitoring program using hydrant.AI data loggers to monitor pressures at strategic locations.
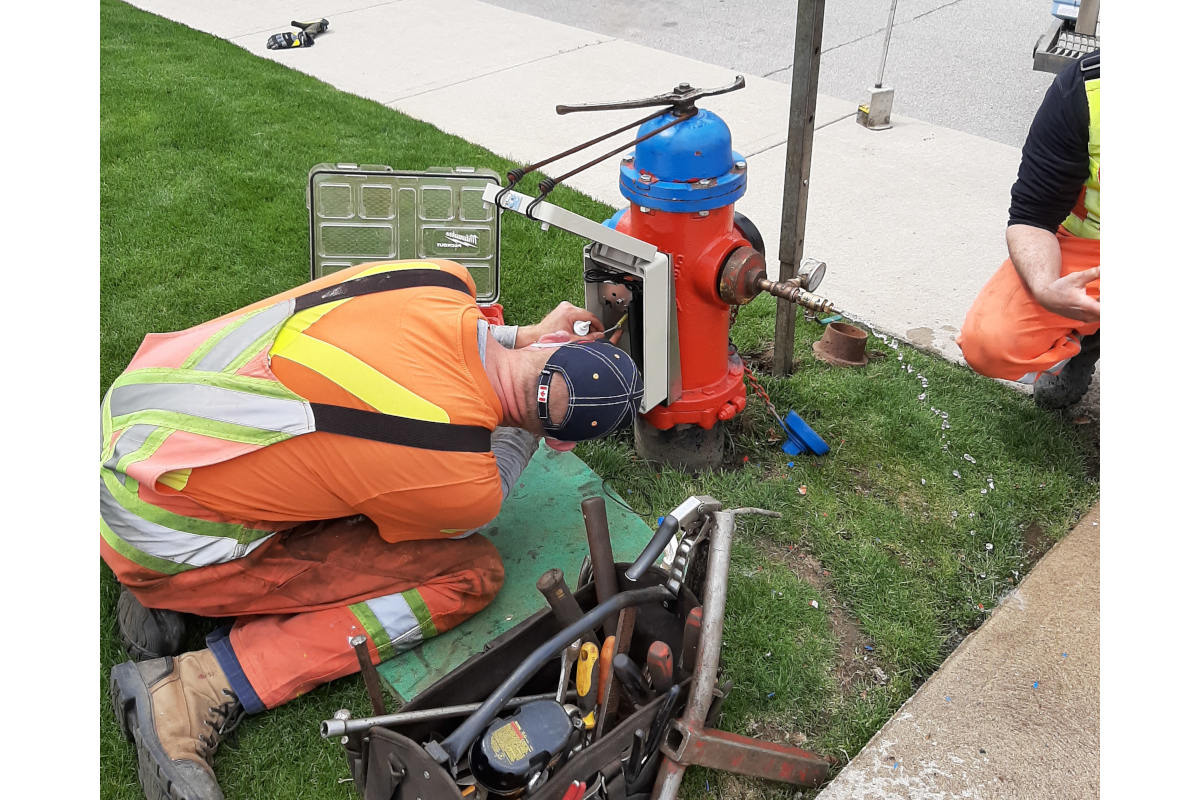
The initial monitoring covered six pressure districts (PD 4, 5, 6, 7, 10, and 16) with hydrant sensors attached to the lower valve of 14 dry barrel hydrants.
The installation of the sensors at the lower valve is critical to allow monitoring of the system pressures during winter months. The lower valve of the hydrant remains closed, thus avoiding water in the hydrant upper barrel that could freeze.
The installation also allows normal operation of the hydrant during fire conditions.
Pressure thresholds for the study were set at:
- Minimum: 40 psi
- Preferred Minimum: 50 psi
- Preferred Maximum: 70 psi
- Maximum:100 psi
The sensors pull 100 samples per second measuring pressure, transients, temperature, and noise that is transmitted to a software platform running machine learning and artificial intelligence models.
System noise can be due to pressure movement, pumps turning on and off, changes in consumption, leakage, theft, boundary valves automatically opening, flushing and maintenance.
When a transient event or sudden change in pressure goes through the system, it captures up to five minutes of data, allowing characterization of the transient’s magnitude and direction.
The software then correlates the event data with other City information, such as GIS, control systems, and customer metering data to get a better understanding of cause and effect.
Correlating Pressure Patterns, Pump Operations and Water Tower Levels
PD 6 had four hydrant loggers and was generally operating within acceptable pressure ranges (61 to 69 psi).
However, there were significant daily pressure fluctuations with noisy data patterns and transient events between May and July. There were also minimum pressure violations (< 20 psi) in late April and early May.
With the data in hand, it was determined that the transients were due to a pump tripping because of sags and surges of the incoming power to the facility. This sudden shutdown led to an abrupt drop in discharge pressure, creating a series of pressure waves or transients that reverberated throughout the system.
Once the fault was resolved and the pump restarted, suction pressure gradually returned to normal, stabilizing the system.
When a sudden change in flow or pressure occurs, it sends shockwaves through the system. These surges, or transient events, stress the water mains particularly at weak points in the pipe network, such as aging joints, thinner-walled sections, or areas with prior repairs.
Over time, these repeated surges can weaken the material until it reaches a breaking point, causing leaks or even full pipe breaks.
In another scenario, PD4 which had 2 monitoring locations, had consistent average pressures between 65 to 81 psi. However, one location regularly exceeded the preferred pressure range, leading to transient events within the 10 to 25 psi range.
The software demonstrated a clear correlation between the pump station discharge pressure and pressure fluctuations. In addition, a higher frequency of transient events was observed in May and July and there was a notable system-wide pressure drop event in April, lasting approximately two hours.
“This detailed data enables us to identify precisely where, when, and why transients are occurring so that we can implement targeted programs and strategies to minimize the occurrence and impact. For example, we can adjust pump operations, install pressure-reducing valves in high-risk areas, and reinforce vulnerable sections,” said Nikolica. “By addressing transient issues proactively, we reduce stress on the system and can prevent many of these breaks and leaks from happening in the first place.”
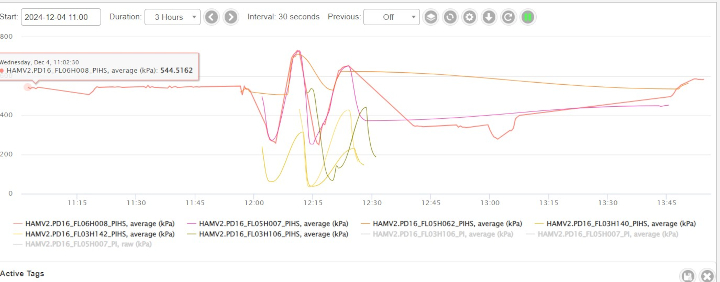
PD16 had one monitoring station and operated within an acceptable range but above the preferred range.
The software identified a clear correlation between pressure patterns, pump operations, and water tower levels.
Pump operations are designed to maintain pressure within certain limits across the system, but fluctuations in demand or system operations—such as pump start-ups and shut-downs—can lead to pressure transients. Water towers help regulate pressure by acting as a buffer and can amplify these transients when they are either over- or under-filled.
When the system is unbalanced, these fluctuations can lead to inefficient pump operations, higher energy consumption, and potential failures in the water distribution system. Addressing the water tower levels to ensure they stay within the preferred range will help reduce pressure transients and improve system efficiency.
Realignment of Existing Pressure Districts
As the City continues to monitor and analyze pressure data, it’s becoming clear that certain PDs may be experiencing higher-than-expected transients due to the way boundaries are currently defined. To address this, the City is assessing whether adjusting PD boundaries could help minimize transients, reduce the occurrence of pressure-related issues, and improve overall system performance.
Staying on Top of Water Quality
In the summer months, as water temperature rises, chlorine decay rates increase, potentially reducing chlorine residuals that can impact water quality.
Using the same sensors in the hydrant, Hamilton, Ontario can monitor temperature closely during these warmer periods and make timely flushing adjustments to maintain water quality.
As temperatures drop below zero in winter, the City uses the temperature data to identify areas at risk for frozen water services. This early detection is essential in preventing service disruptions and allows the City to take proactive measures to protect against freezing.
“By continuously monitoring water temperature, the hydrant.AI technology helps us respond dynamically to seasonal challenges, safeguarding water quality and reliability year-round,” said Nikolica.
Pinpointing Leaks and Breaks
From 2013 to 2022, the City experienced an average of approximately 296 water main breaks per year. In 2023, it dropped significantly to 188, and Nikolica anticipates fewer than 200 breaks in 2024.
This decline is due to several factors, including temperature, proactive structural lining of older water mains, replacement of aging mains through the City’s capital re-construction programs, and enhanced maintenance of critical infrastructure, such as pressure-reducing and air valves. Each of these elements plays a vital role in maintaining system stability.
Milder winters reduce stress on pipes, while structural lining projects add resilience to aging water mains, and well-maintained valves help regulate pressure surges that could lead to breaks.
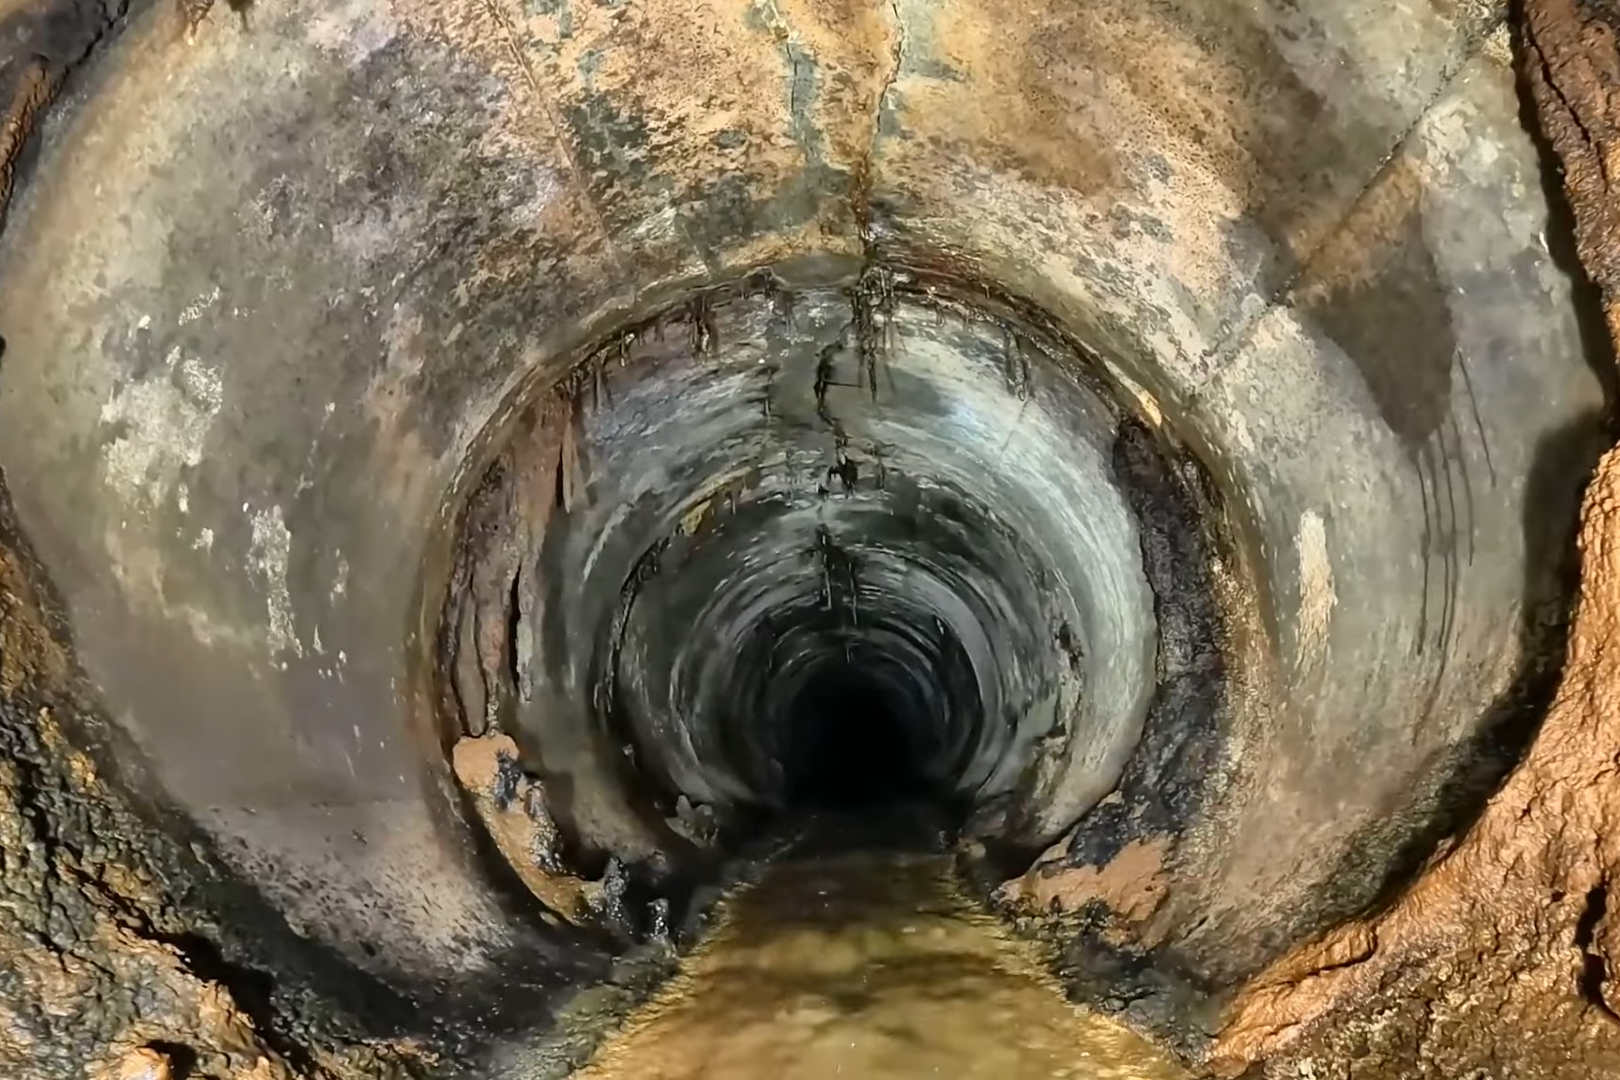
Hamilton’s geography and geology i.e. shale, makes it prone to underground leaks that have historically gone undetected. The new technology plays a pivotal role in pinpointing potential breaks and leaks and has already identified leaks for crews to repair before they escalate.
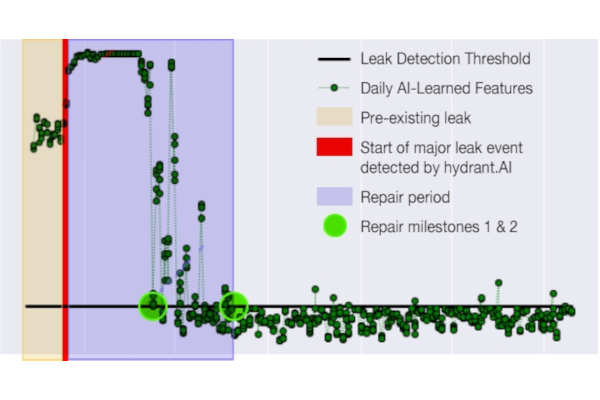
One example occurred in PD5 where two leaks were identified within a month of installing the hydrant.AI units.
The sensors identified a pre-existing leak within the system, and the development of a second leak. These leaks were non-surfacing, and the geology of the area allowed water to rapidly drain away, so they may not have surfaced.
The AI models have learned features to create a fingerprint of leaks, thus providing the ability to identify pre-existing leaks in the network, as well as new and developing leaks. Modelling determines the distance of the leak from the sensors, providing the City with a location to investigate.
The software determined the presence of a pre-existing leak, the start of a more major leak, and the repairs completed in the system.
In December there were two watermain breaks in PD16. The flow monitoring data showed significant discharge pressure changes at the York Road Pumping Station, which supplies this area.
Based on the information, it was determined that the SCADA’s auto mode attempted to pump more water than required in response to the system change, causing the pump to trip due to high pressure.
When this occurred, another pump started in response, but it eventually tripped. At that point, plant operations took manual control of the station, which then remained stable.
“Unfortunately, transients caused by these rapid changes in pump discharge pressures likely contributed to the watermain breaks in PD16. Having the data to understand the reason for such events is valuable in preventing further breaks in the pressure district,” said Nikolica.
Creating a Sustainable Future
“The pilot project has clearly demonstrated the value of comprehensive continuous pressure monitoring in identifying system operational patterns, potential vulnerabilities, and optimization opportunities,” said Nikolica.
The City is forming a dedicated working group to develop and implement targeted strategies focused on minimizing pressure transients, optimizing pumping and improving overall system stability by expanding advanced monitoring and control capabilities.
Tasks Include
- Regular analysis of data and identification of areas with frequent or significant pressure fluctuations and prioritize PDs for corrective action.
- Enhancement of maintenance programs with emphasis on vulnerable zones with regular pressure issues. Routinely check pressure-reducing valves and air valves for wear and tear and address any signs of malfunction promptly to prevent further system strain.
- Determine if moving boundaries in some PDs can minimize transients.
- Explore options for variable frequency drives (VFDs) at pumping stations to switch pumps on and off gradually, rather than abruptly.
- Use real-time data for calibration of hydraulic models and explore modeling of digital twins.
Ultimately these improvements will help reduce the risk of system failures, lower operational costs, and enhance the efficiency of the water distribution system.
“As the program progresses, we envision a more integrated approach where this technology not only identifies pressure issues but also automates real-time adjustments to pumps, valves, and other infrastructure to prevent potential problems before they occur,” concluded Nikolica.
Dave Alberton is manager of Water Distribution & Wastewater Collection for Hamilton Water. Tim Sutherns is senior expert advisor, digital solutions for Eramosa – a CIMA+ Company.